29
/
en
AIzaSyAYiBZKx7MnpbEhh9jyipgxe19OcubqV5w
April 1, 2024
58377
South Asia (IDA & IBRD)
TSA
false
2
1
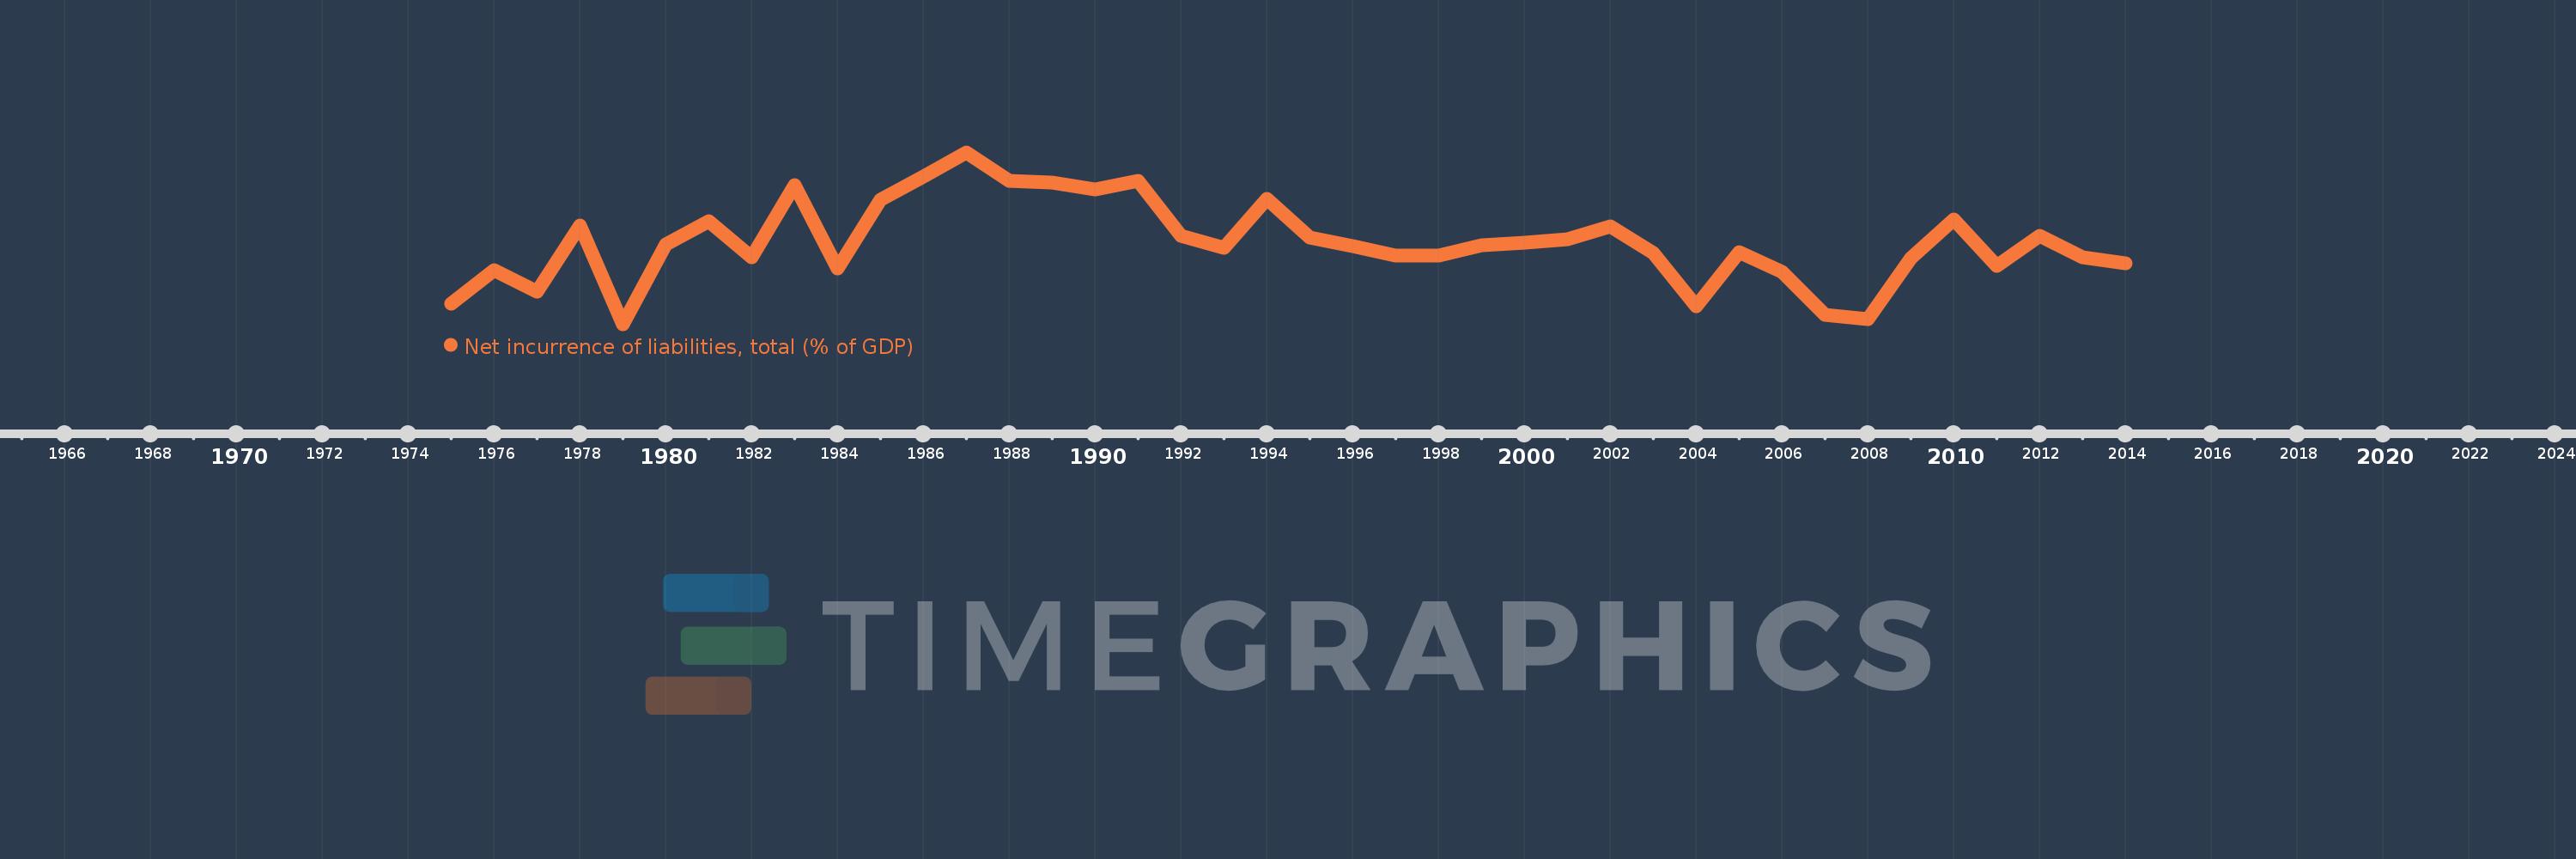
Net incurrence of liabilities, total (% of GDP)
2014,2013,2012,2011,2010,2009,2008,2007,2006,2005,2004,2003,2002,2001,2000,1999,1998,1997,1996,1995,1994,1993,1992,1991,1990,1989,1988,1987,1986,1985,1984,1983,1982,1981,1980,1979,1978,1977,1976,1975
This statistics in other country:
Timeline:
This timeline shows a graph from 1975 to 2014 of South Asia (IDA & IBRD). No data until 1974. Number of actual observations by date: 40.
Source name:
World Development Indicators
Source organization:
International Monetary Fund, Government Finance Statistics Yearbook and data files.
Categories, topics:
Public Sector
Last updated:
apr 23, 2017
Indicators value changes by year
At the date of observation
Value
Absolute change
Change from previous value
jan 1, 1975
2.994
+2.994
0.0%
jan 1, 1976
4.241
+1.247
41.66%
jan 1, 1977
3.441
-0.799
-18.85%
jan 1, 1978
5.868
+2.426
70.51%
jan 1, 1979
2.236
-3.632
-61.9%
jan 1, 1980
5.172
+2.937
131.36%
jan 1, 1981
6.041
+0.869
16.8%
jan 1, 1982
4.7
-1.342
-22.21%
jan 1, 1983
7.365
+2.665
56.72%
jan 1, 1984
4.294
-3.071
-41.7%
jan 1, 1985
6.824
+2.531
58.94%
jan 1, 1986
7.687
+0.863
12.64%
jan 1, 1987
8.576
+0.888
11.56%
jan 1, 1988
7.527
-1.048
-12.22%
jan 1, 1989
7.474
-0.054
-0.71%
jan 1, 1990
7.211
-0.263
-3.52%
jan 1, 1991
7.533
+0.322
4.47%
jan 1, 1992
5.483
-2.05
-27.21%
jan 1, 1993
5.057
-0.426
-7.77%
jan 1, 1994
6.864
+1.807
35.73%
jan 1, 1995
5.425
-1.44
-20.97%
jan 1, 1996
5.111
-0.313
-5.78%
jan 1, 1997
4.772
-0.339
-6.64%
jan 1, 1998
4.759
-0.012
-0.26%
jan 1, 1999
5.149
+0.389
8.18%
jan 1, 2000
5.236
+0.087
1.7%
jan 1, 2001
5.377
+0.141
2.69%
jan 1, 2002
5.86
+0.484
8.99%
jan 1, 2003
4.851
-1.009
-17.22%
jan 1, 2004
2.891
-1.961
-40.42%
jan 1, 2005
4.9
+2.009
69.51%
jan 1, 2006
4.182
-0.718
-14.66%
jan 1, 2007
2.566
-1.616
-38.64%
jan 1, 2008
2.436
-0.13
-5.06%
jan 1, 2009
4.677
+2.241
91.98%
jan 1, 2010
6.112
+1.436
30.69%
jan 1, 2011
4.389
-1.724
-28.2%
jan 1, 2012
5.483
+1.094
24.94%
jan 1, 2013
4.719
-0.764
-13.93%
jan 1, 2014
4.47
-0.249
-5.28%
Ranking of countries by current statistics by years


Comments: