29
/
en
AIzaSyAYiBZKx7MnpbEhh9jyipgxe19OcubqV5w
April 1, 2024
153840
Iceland
ISL
true
2
1
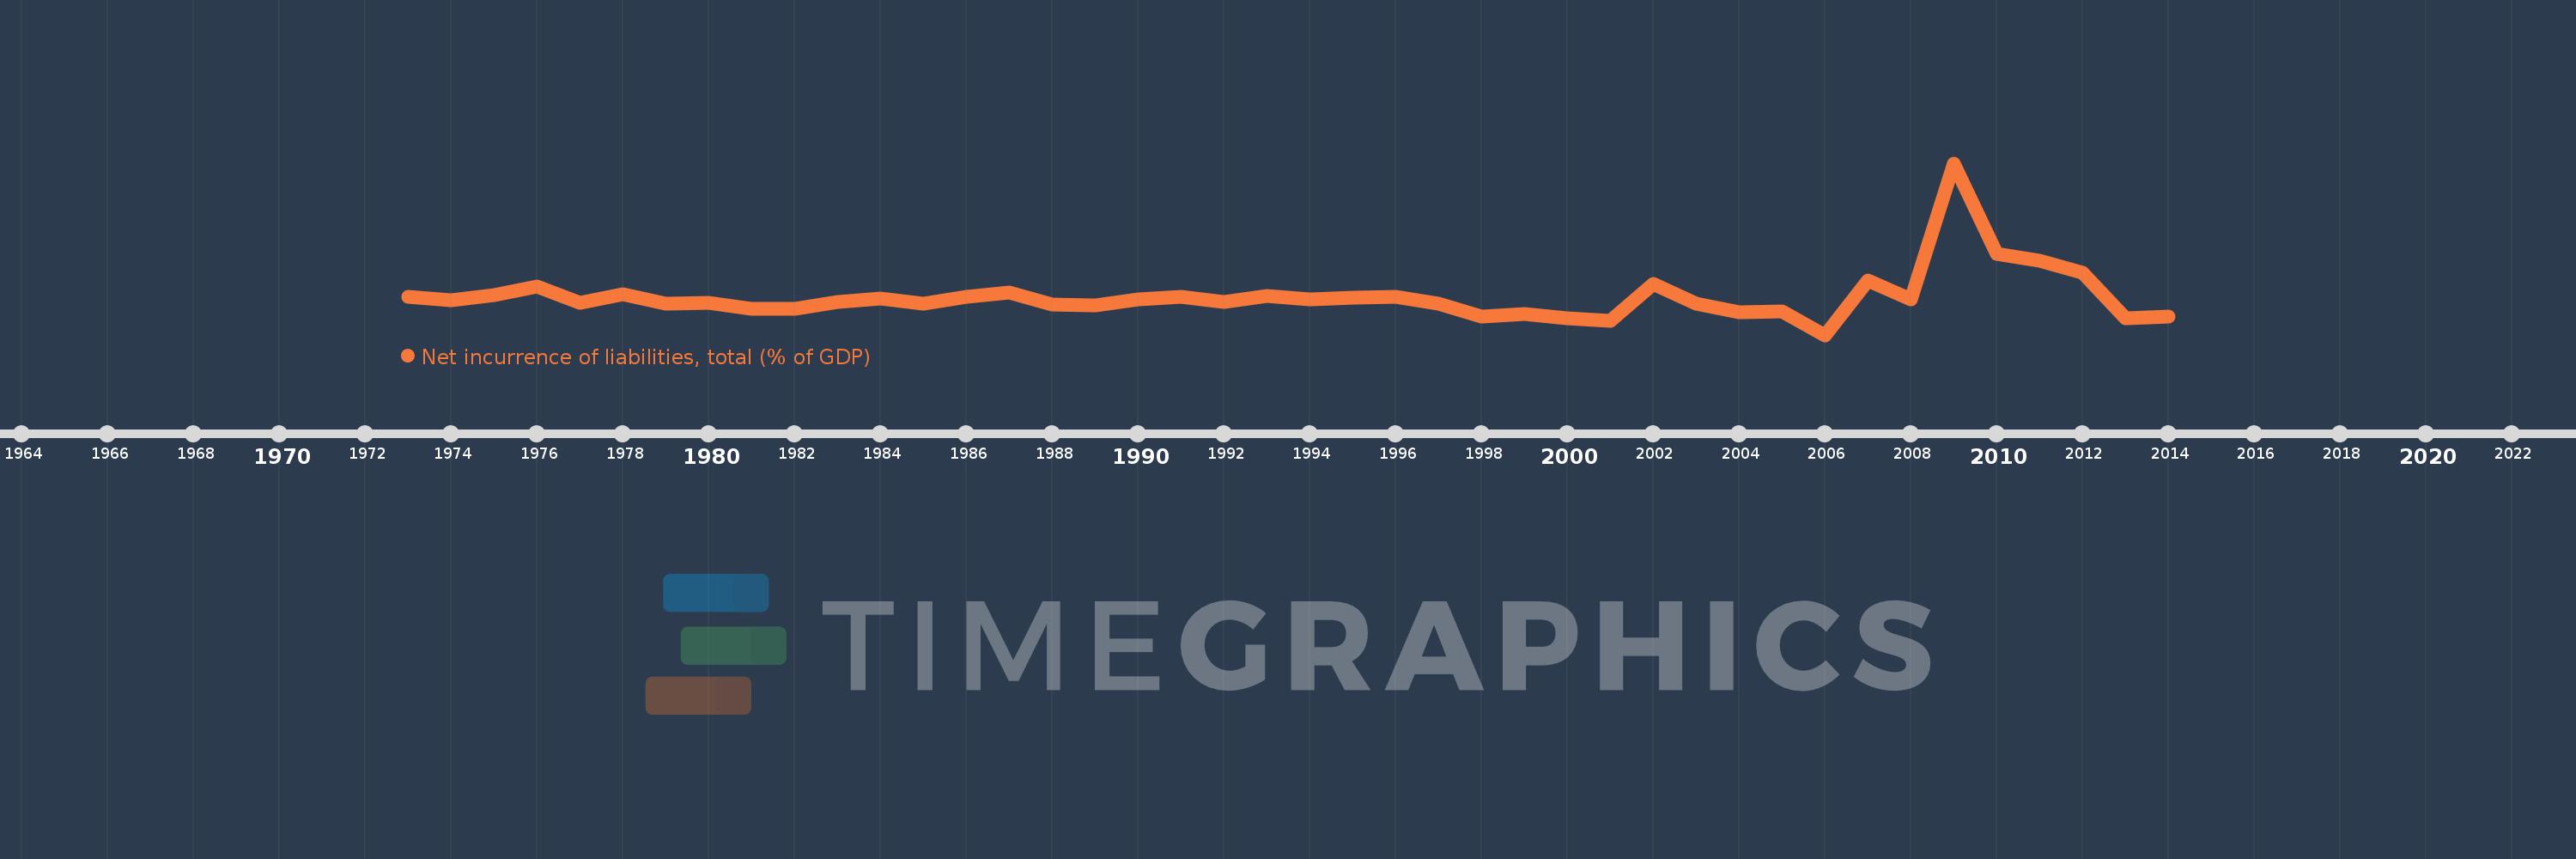
Net incurrence of liabilities, total (% of GDP)
2014,2013,2012,2011,2010,2009,2008,2007,2006,2005,2004,2003,2002,2001,2000,1999,1998,1997,1996,1995,1994,1993,1992,1991,1990,1989,1988,1987,1986,1985,1984,1983,1982,1981,1980,1979,1978,1977,1976,1975,1974,1973
This statistics in other country:
Timeline:
This timeline shows a graph from 1973 to 2014 of Iceland. No data until 1972. Number of actual observations by date: 42.
Source name:
World Development Indicators
Source organization:
International Monetary Fund, Government Finance Statistics Yearbook and data files.
Categories, topics:
Public Sector
Last updated:
apr 23, 2017
Indicators value changes by year
Minimum:
-4.459
jan 1, 2006
Maximum:
32.225
jan 1, 2009
At the date of observation
Value
Absolute change
Change from previous value
jan 1, 1973
3.708
+3.708
0.0%
jan 1, 1974
2.946
-0.762
-20.55%
jan 1, 1975
4.035
+1.089
36.97%
jan 1, 1976
5.908
+1.874
46.44%
jan 1, 1977
2.446
-3.462
-58.6%
jan 1, 1978
4.28
+1.834
74.96%
jan 1, 1979
2.234
-2.045
-47.79%
jan 1, 1980
2.397
+0.162
7.26%
jan 1, 1981
1.079
-1.318
-55.0%
jan 1, 1982
1.198
+0.12
11.08%
jan 1, 1983
2.517
+1.319
110.12%
jan 1, 1984
3.316
+0.799
31.74%
jan 1, 1985
2.23
-1.087
-32.77%
jan 1, 1986
3.663
+1.433
64.28%
jan 1, 1987
4.67
+1.007
27.5%
jan 1, 1988
2.044
-2.626
-56.23%
jan 1, 1989
1.821
-0.223
-10.9%
jan 1, 1990
3.142
+1.32
72.49%
jan 1, 1991
3.615
+0.473
15.07%
jan 1, 1992
2.594
-1.021
-28.25%
jan 1, 1993
3.836
+1.242
47.88%
jan 1, 1994
3.194
-0.642
-16.74%
jan 1, 1995
3.442
+0.248
7.76%
jan 1, 1996
3.654
+0.212
6.17%
jan 1, 1997
2.22
-1.434
-39.26%
jan 1, 1998
-0.492
-2.712
-122.17%
jan 1, 1999
-0.015
+0.477
-97.02%
jan 1, 2000
-0.794
-0.779
5.32K%
jan 1, 2001
-1.407
-0.613
77.19%
jan 1, 2002
6.486
+7.893
-560.95%
jan 1, 2003
2.217
-4.268
-65.81%
jan 1, 2004
0.409
-1.809
-81.57%
jan 1, 2005
0.568
+0.159
38.9%
jan 1, 2006
-4.459
-5.027
-885.47%
jan 1, 2007
7.153
+11.613
-260.42%
jan 1, 2008
3.13
-4.023
-56.24%
jan 1, 2009
32.225
+29.095
929.41%
jan 1, 2010
12.877
-19.349
-60.04%
jan 1, 2011
11.341
-1.536
-11.93%
jan 1, 2012
8.858
-2.483
-21.9%
jan 1, 2013
-0.915
-9.773
-110.33%
jan 1, 2014
-0.575
+0.339
-37.1%
Ranking of countries by current statistics by years


Comments: