29
/
en
AIzaSyAYiBZKx7MnpbEhh9jyipgxe19OcubqV5w
April 1, 2024
170279
Korea, Rep.
KOR
true
2
1
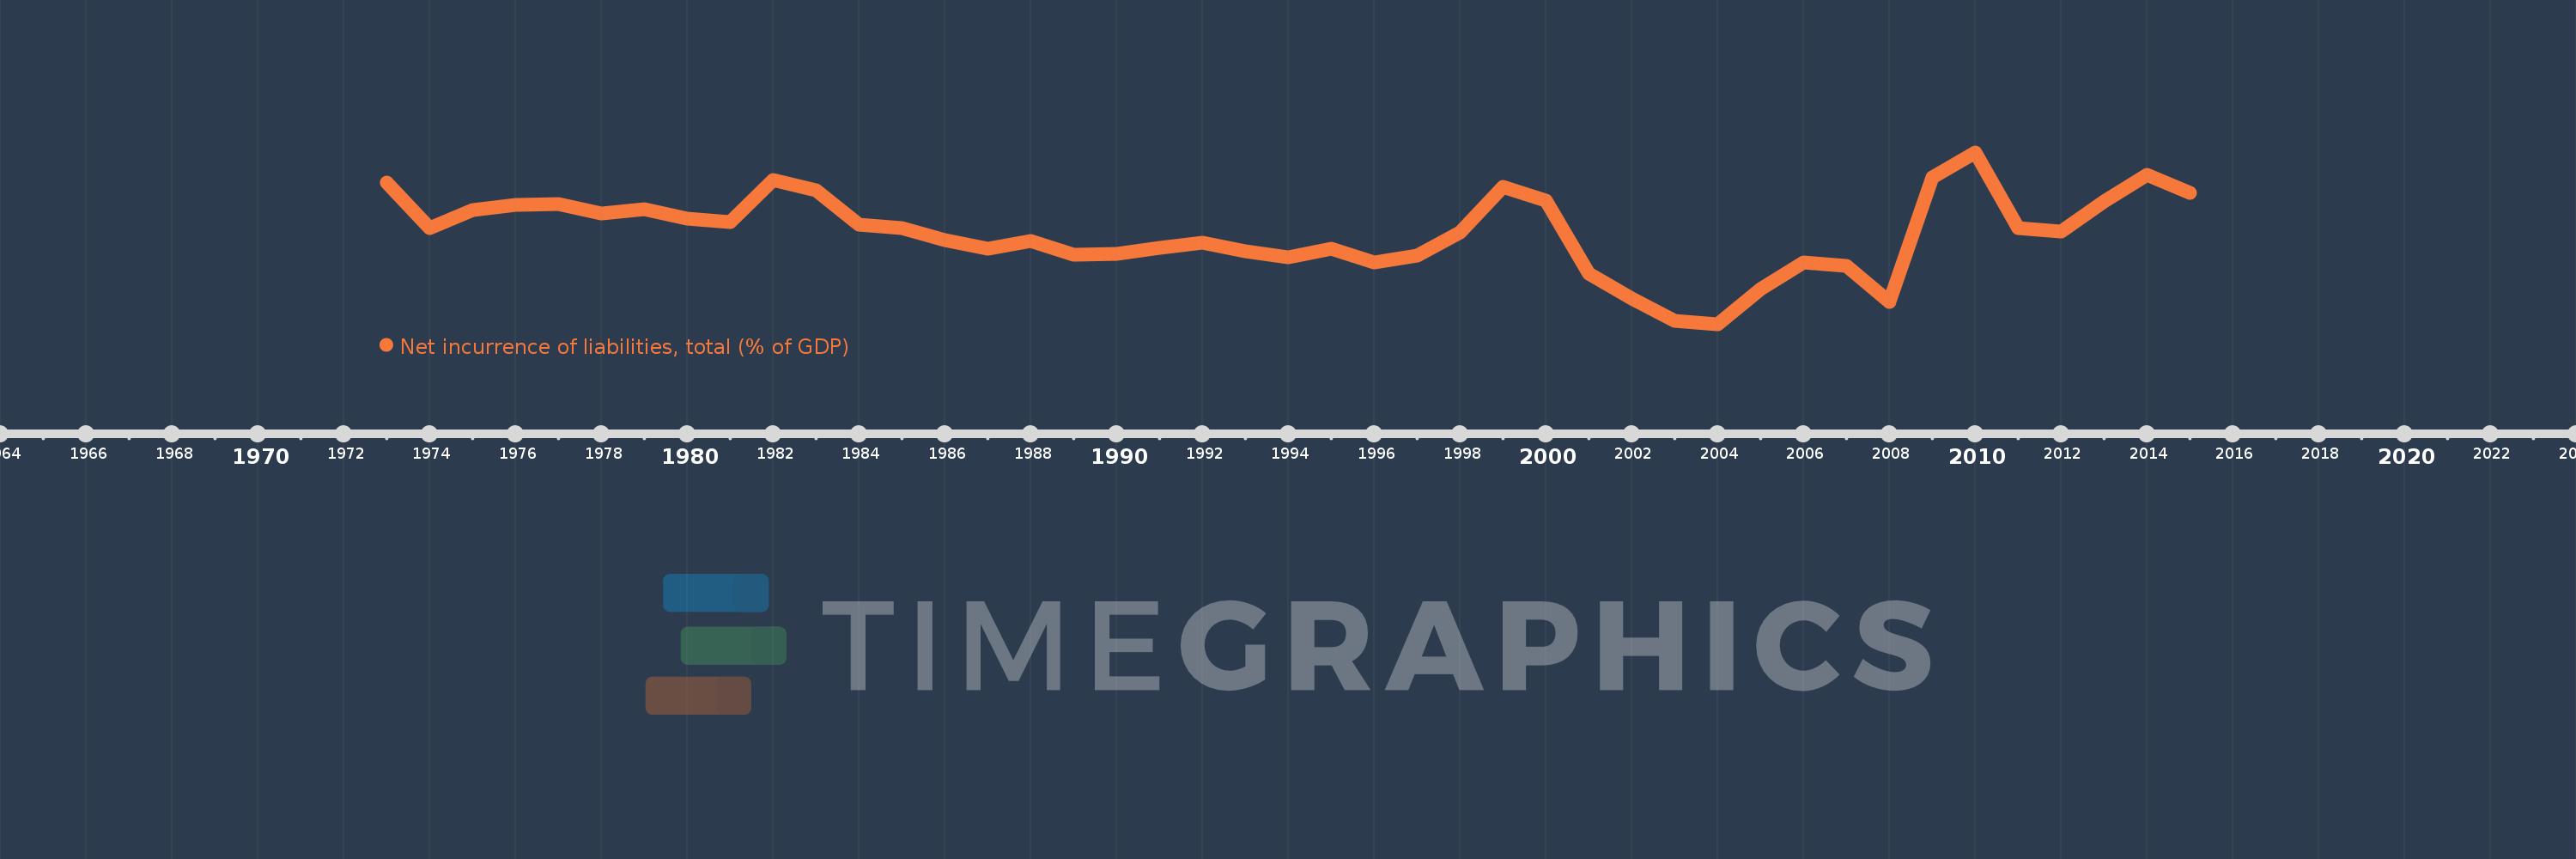
Net incurrence of liabilities, total (% of GDP)
2015,2014,2013,2012,2011,2010,2009,2008,2007,2006,2005,2004,2003,2002,2001,2000,1999,1998,1997,1996,1995,1994,1993,1992,1991,1990,1989,1988,1987,1986,1985,1984,1983,1982,1981,1980,1979,1978,1977,1976,1975,1974,1973
This statistics in other country:
Timeline:
This timeline shows a graph from 1973 to 2015 of Korea, Rep.. No data until 1972. Number of actual observations by date: 43.
Source name:
World Development Indicators
Source organization:
International Monetary Fund, Government Finance Statistics Yearbook and data files.
Categories, topics:
Public Sector
Last updated:
apr 23, 2017
Indicators value changes by year
Minimum:
-3.398
jan 1, 2004
At the date of observation
Value
Absolute change
Change from previous value
jan 1, 1973
3.515
+3.515
0.0%
jan 1, 1974
1.278
-2.237
-63.65%
jan 1, 1975
2.167
+0.889
69.55%
jan 1, 1976
2.402
+0.235
10.85%
jan 1, 1977
2.432
+0.03
1.24%
jan 1, 1978
2.002
-0.43
-17.68%
jan 1, 1979
2.185
+0.183
9.17%
jan 1, 1980
1.76
-0.425
-19.46%
jan 1, 1981
1.59
-0.17
-9.64%
jan 1, 1982
3.619
+2.028
127.55%
jan 1, 1983
3.1
-0.519
-14.35%
jan 1, 1984
1.437
-1.663
-53.64%
jan 1, 1985
1.276
-0.161
-11.22%
jan 1, 1986
0.705
-0.571
-44.76%
jan 1, 1987
0.296
-0.408
-57.93%
jan 1, 1988
0.655
+0.358
120.8%
jan 1, 1989
-0.014
-0.669
-102.17%
jan 1, 1990
0.007
+0.021
-150.62%
jan 1, 1991
0.303
+0.295
4.11K%
jan 1, 1992
0.56
+0.257
84.91%
jan 1, 1993
0.154
-0.405
-72.43%
jan 1, 1994
-0.155
-0.31
-200.72%
jan 1, 1995
0.272
+0.427
-274.92%
jan 1, 1996
-0.379
-0.651
-239.32%
jan 1, 1997
-0.063
+0.316
-83.47%
jan 1, 1998
1.064
+1.127
-1.8K%
jan 1, 1999
3.307
+2.243
210.74%
jan 1, 2000
2.61
-0.697
-21.07%
jan 1, 2001
-0.933
-3.543
-135.73%
jan 1, 2002
-2.14
-1.208
129.51%
jan 1, 2003
-3.215
-1.075
50.24%
jan 1, 2004
-3.398
-0.182
5.66%
jan 1, 2005
-1.7
+1.698
-49.98%
jan 1, 2006
-0.398
+1.301
-76.56%
jan 1, 2007
-0.572
-0.173
43.54%
jan 1, 2008
-2.313
-1.741
304.38%
jan 1, 2009
3.758
+6.071
-262.51%
jan 1, 2010
4.963
+1.205
32.05%
jan 1, 2011
1.269
-3.694
-74.43%
jan 1, 2012
1.127
-0.142
-11.21%
jan 1, 2013
2.596
+1.469
130.39%
jan 1, 2014
3.854
+1.259
48.49%
jan 1, 2015
2.985
-0.869
-22.55%
Ranking of countries by current statistics by years


Comments: