29
/
en
AIzaSyAYiBZKx7MnpbEhh9jyipgxe19OcubqV5w
April 1, 2024
47442
Lower middle income
LMC
false
2
1
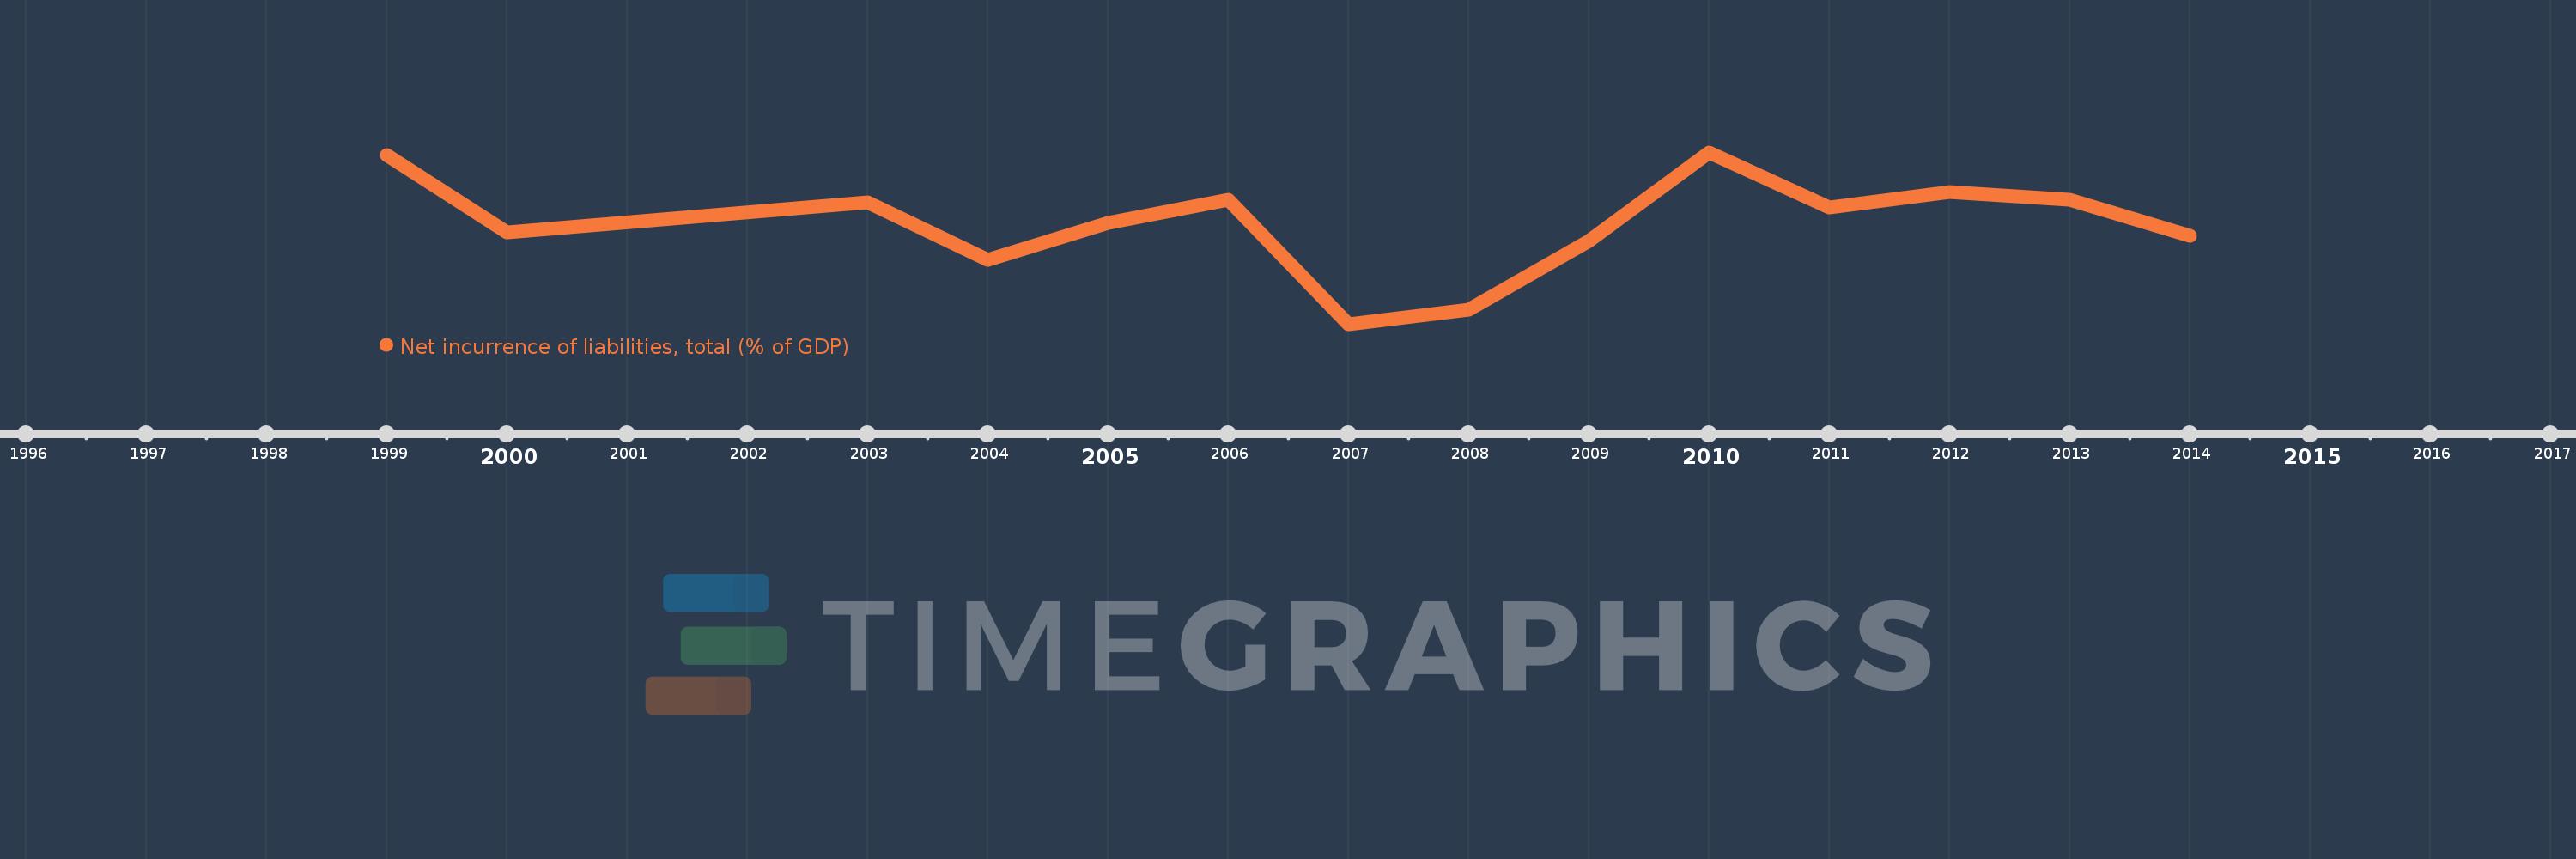
Net incurrence of liabilities, total (% of GDP)
2014,2013,2012,2011,2010,2009,2008,2007,2006,2005,2004,2003,2000,1999
This statistics in other country:
Timeline:
This timeline shows a graph from 1999 to 2014 of Lower middle income. No data until 1998. Number of actual observations by date: 14.
Source name:
World Development Indicators
Source organization:
International Monetary Fund, Government Finance Statistics Yearbook and data files.
Categories, topics:
Public Sector
Last updated:
apr 23, 2017
Indicators value changes by year
At the date of observation
Value
Absolute change
Change from previous value
jan 1, 1999
5.027
+5.027
0.0%
jan 1, 2000
3.694
-1.334
-26.53%
jan 1, 2003
4.219
+0.526
14.23%
jan 1, 2004
3.219
-1.0
-23.71%
jan 1, 2005
3.853
+0.634
19.7%
jan 1, 2006
4.251
+0.397
10.31%
jan 1, 2007
2.107
-2.144
-50.44%
jan 1, 2008
2.357
+0.25
11.89%
jan 1, 2009
3.54
+1.183
50.18%
jan 1, 2010
5.075
+1.535
43.37%
jan 1, 2011
4.12
-0.955
-18.82%
jan 1, 2012
4.397
+0.277
6.72%
jan 1, 2013
4.256
-0.141
-3.21%
jan 1, 2014
3.637
-0.618
-14.53%
Ranking of countries by current statistics by years


Comments: