29
/
en
AIzaSyAYiBZKx7MnpbEhh9jyipgxe19OcubqV5w
April 1, 2024
215597
Oman
OMN
true
2
1
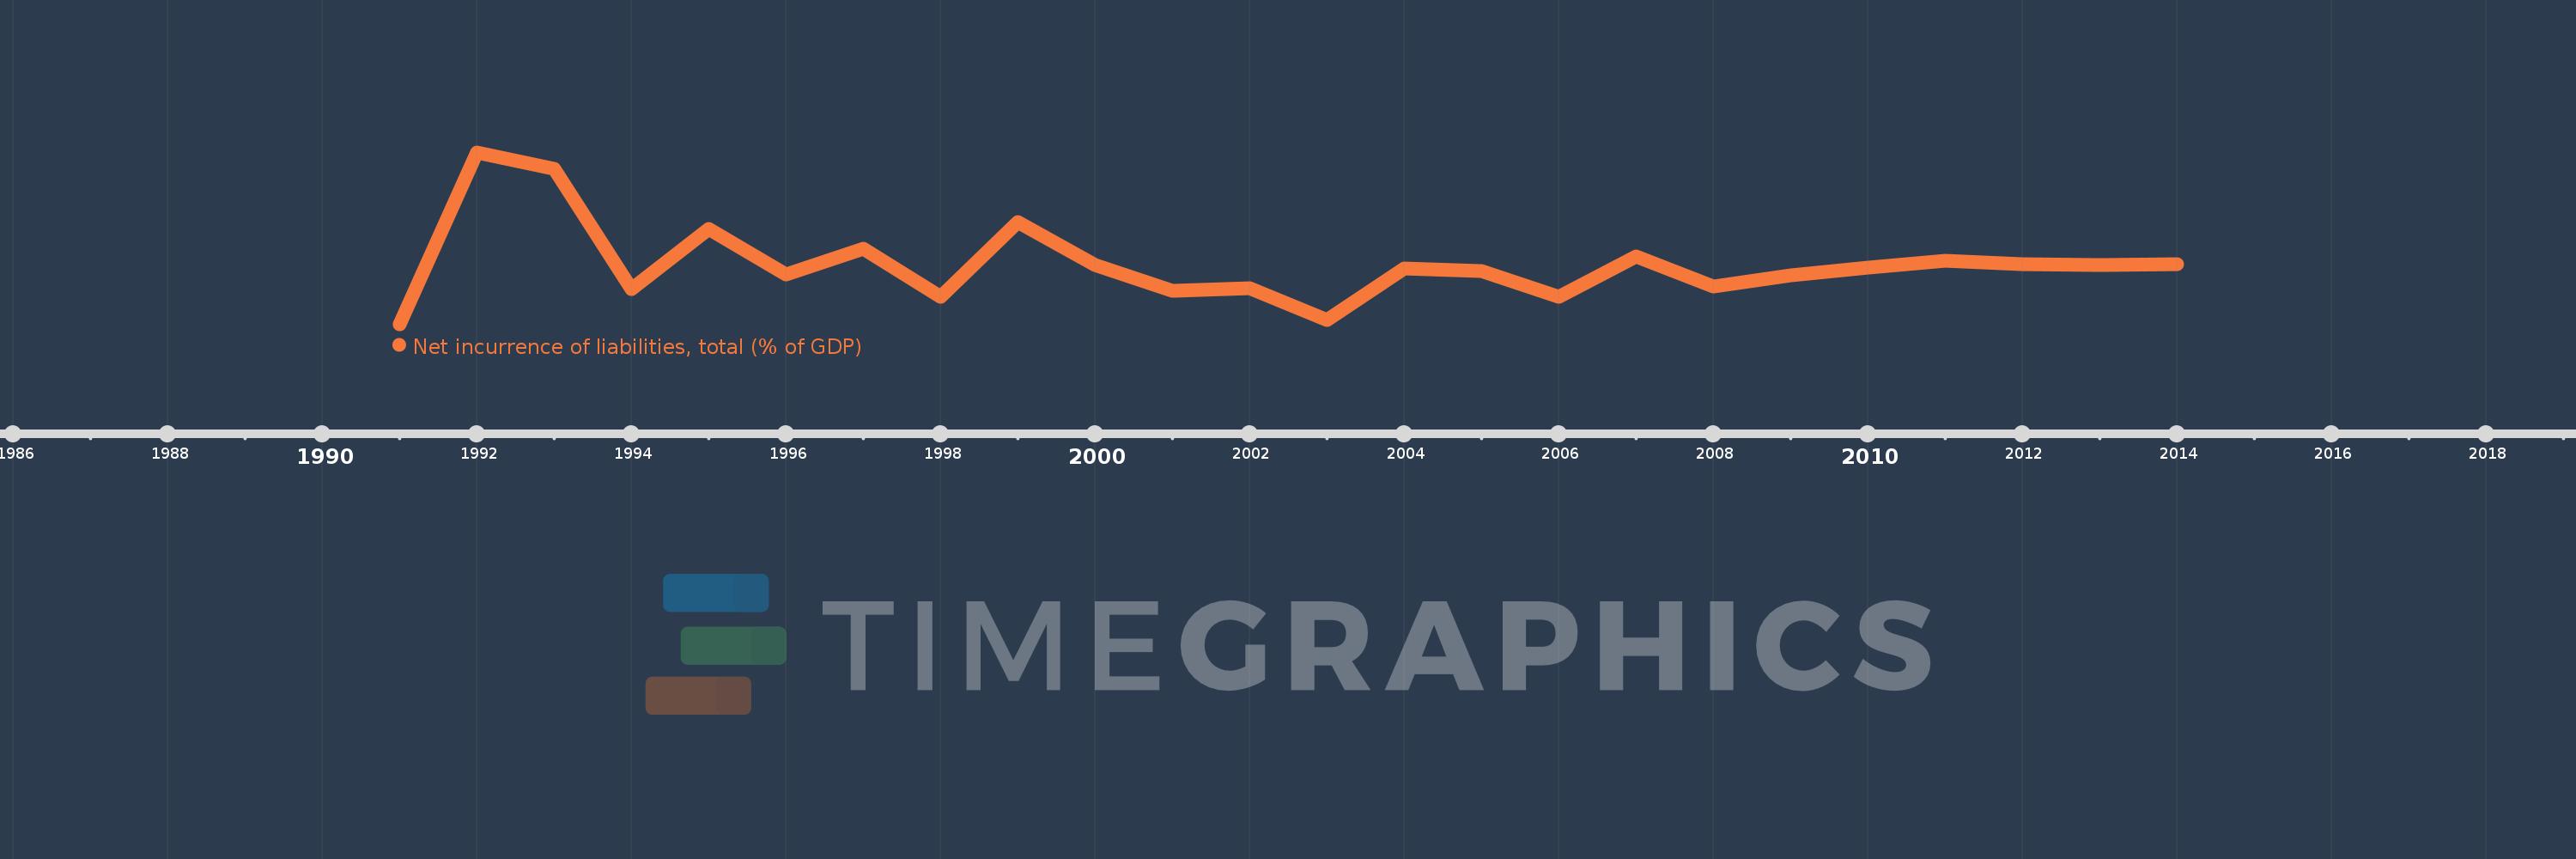
Net incurrence of liabilities, total (% of GDP)
2014,2013,2012,2011,2010,2009,2008,2007,2006,2005,2004,2003,2002,2001,2000,1999,1998,1997,1996,1995,1994,1993,1992,1991
This statistics in other country:
Timeline:
This timeline shows a graph from 1991 to 2014 of Oman. No data until 1990. Number of actual observations by date: 24.
Source name:
World Development Indicators
Source organization:
International Monetary Fund, Government Finance Statistics Yearbook and data files.
Categories, topics:
Public Sector
Last updated:
apr 23, 2017
Indicators value changes by year
At the date of observation
Value
Absolute change
Change from previous value
jan 1, 1991
-2.76
-2.76
0.0%
jan 1, 1992
6.322
+9.082
-329.07%
jan 1, 1993
5.462
-0.861
-13.61%
jan 1, 1994
-0.906
-6.367
-116.58%
jan 1, 1995
2.295
+3.201
-353.43%
jan 1, 1996
-0.151
-2.446
-106.57%
jan 1, 1997
1.219
+1.37
-908.58%
jan 1, 1998
-1.309
-2.528
-207.38%
jan 1, 1999
2.631
+3.94
-301.03%
jan 1, 2000
0.371
-2.26
-85.91%
jan 1, 2001
-0.979
-1.349
-363.89%
jan 1, 2002
-0.862
+0.116
-11.88%
jan 1, 2003
-2.528
-1.666
193.16%
jan 1, 2004
0.183
+2.711
-107.23%
jan 1, 2005
0.038
-0.145
-79.31%
jan 1, 2006
-1.331
-1.369
-3.62K%
jan 1, 2007
0.807
+2.138
-160.63%
jan 1, 2008
-0.784
-1.591
-197.08%
jan 1, 2009
-0.154
+0.63
-80.38%
jan 1, 2010
0.215
+0.369
-239.85%
jan 1, 2011
0.582
+0.367
170.86%
jan 1, 2012
0.425
-0.157
-26.96%
jan 1, 2013
0.384
-0.041
-9.66%
jan 1, 2014
0.415
+0.031
8.04%
Ranking of countries by current statistics by years


Comments: