29
/
en
AIzaSyAYiBZKx7MnpbEhh9jyipgxe19OcubqV5w
April 1, 2024
241930
Slovak Republic
SVK
true
2
1
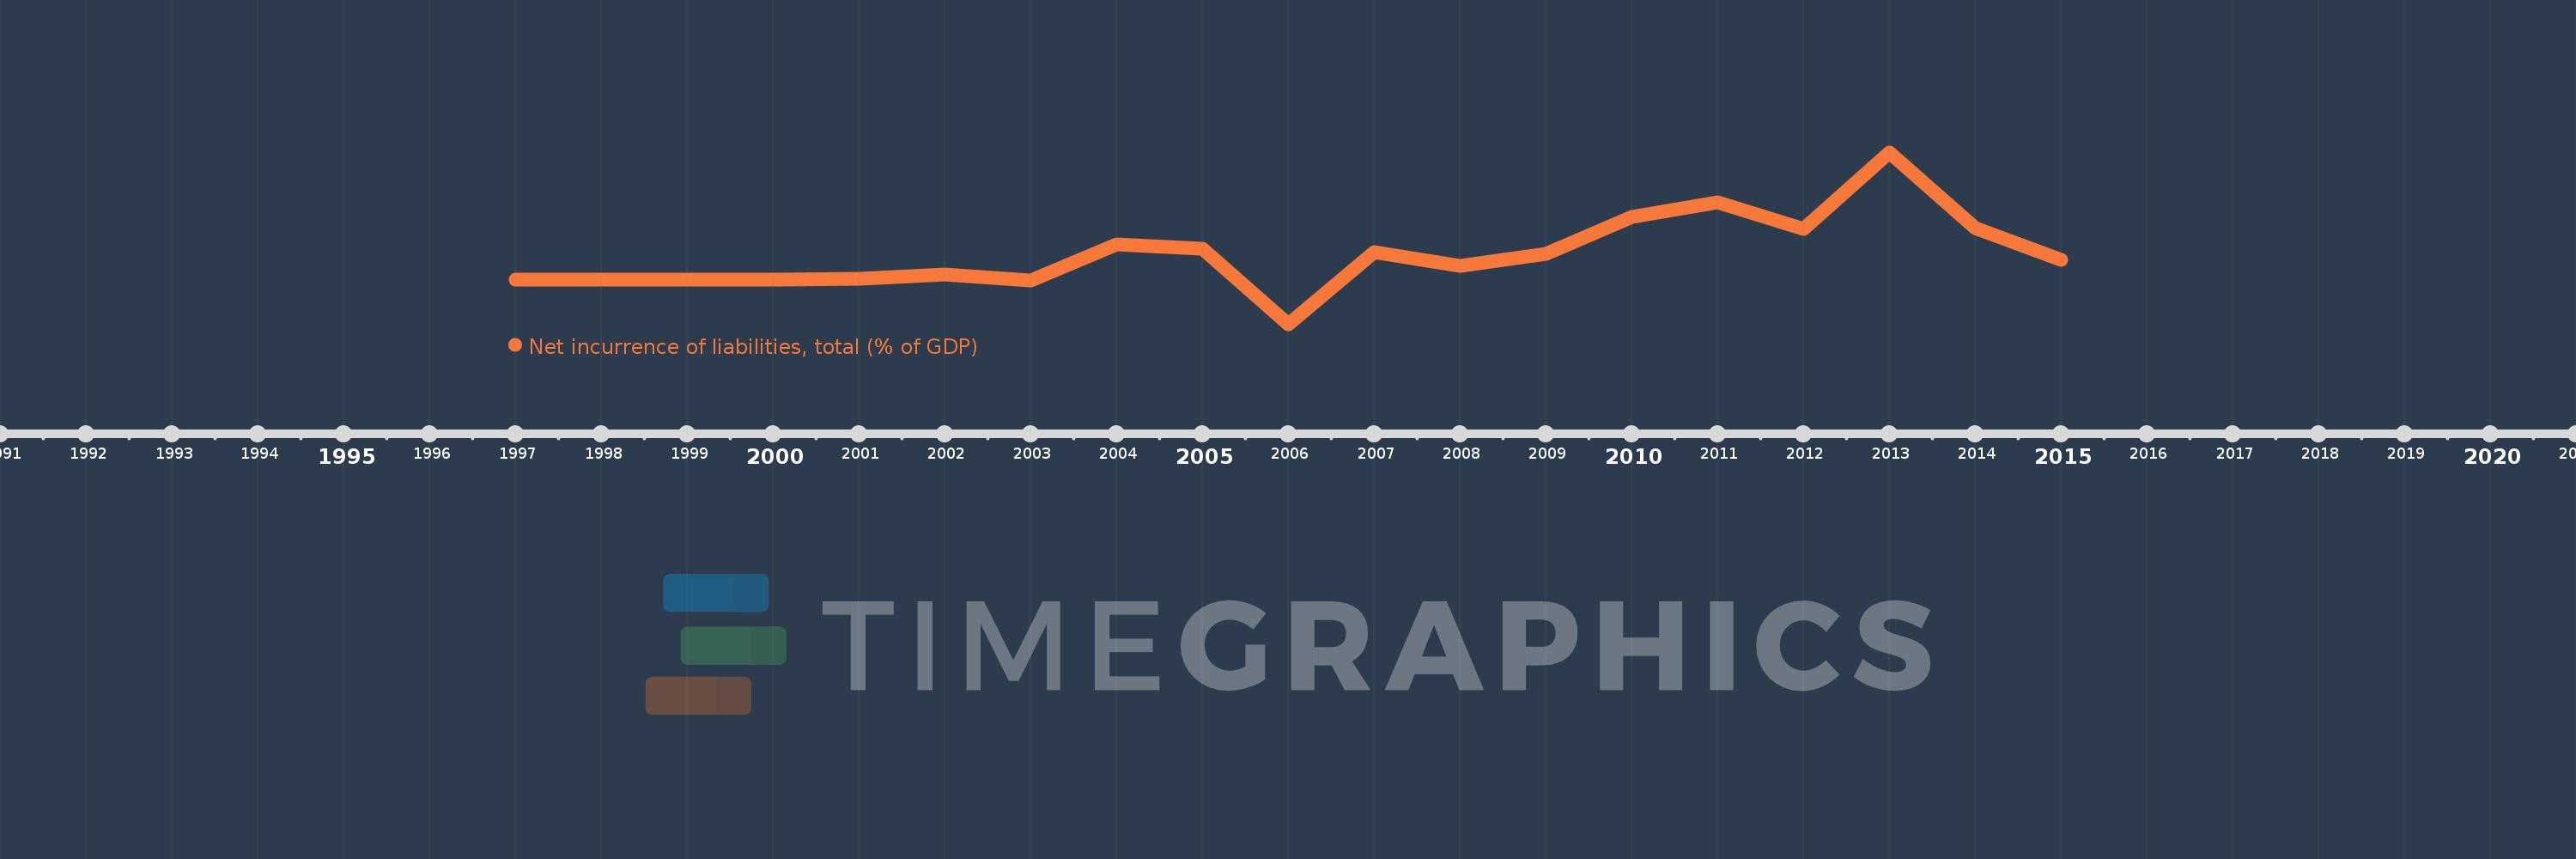
Net incurrence of liabilities, total (% of GDP)
2015,2014,2013,2012,2011,2010,2009,2008,2007,2006,2005,2004,2003,2002,2001,2000,1999,1998,1997
This statistics in other country:
Timeline:
This timeline shows a graph from 1997 to 2015 of Slovak Republic. No data until 1996. Number of actual observations by date: 19.
Source name:
World Development Indicators
Source organization:
International Monetary Fund, Government Finance Statistics Yearbook and data files.
Categories, topics:
Public Sector
Last updated:
apr 23, 2017
Indicators value changes by year
Minimum:
-3.732
jan 1, 2006
Maximum:
10.797
jan 1, 2013
At the date of observation
Value
Absolute change
Change from previous value
jan 1, 1997
0.03
+0.03
0.0%
jan 1, 1998
0.071
+0.041
137.34%
jan 1, 1999
0.068
-0.003
-4.14%
jan 1, 2000
0.065
-0.003
-4.35%
jan 1, 2001
0.091
+0.025
38.91%
jan 1, 2002
0.472
+0.381
419.52%
jan 1, 2003
-0.007
-0.478
-101.46%
jan 1, 2004
2.999
+3.006
-43.69K%
jan 1, 2005
2.631
-0.368
-12.28%
jan 1, 2006
-3.732
-6.363
-241.88%
jan 1, 2007
2.335
+6.067
-162.55%
jan 1, 2008
1.204
-1.131
-48.43%
jan 1, 2009
2.182
+0.978
81.24%
jan 1, 2010
5.351
+3.169
145.2%
jan 1, 2011
6.552
+1.2
22.43%
jan 1, 2012
4.356
-2.196
-33.52%
jan 1, 2013
10.797
+6.441
147.88%
jan 1, 2014
4.394
-6.403
-59.31%
jan 1, 2015
1.696
-2.698
-61.4%
Ranking of countries by current statistics by years


Comments: