29
/
en
AIzaSyAYiBZKx7MnpbEhh9jyipgxe19OcubqV5w
April 1, 2024
76753
Bahamas, The
BHS
true
2
1
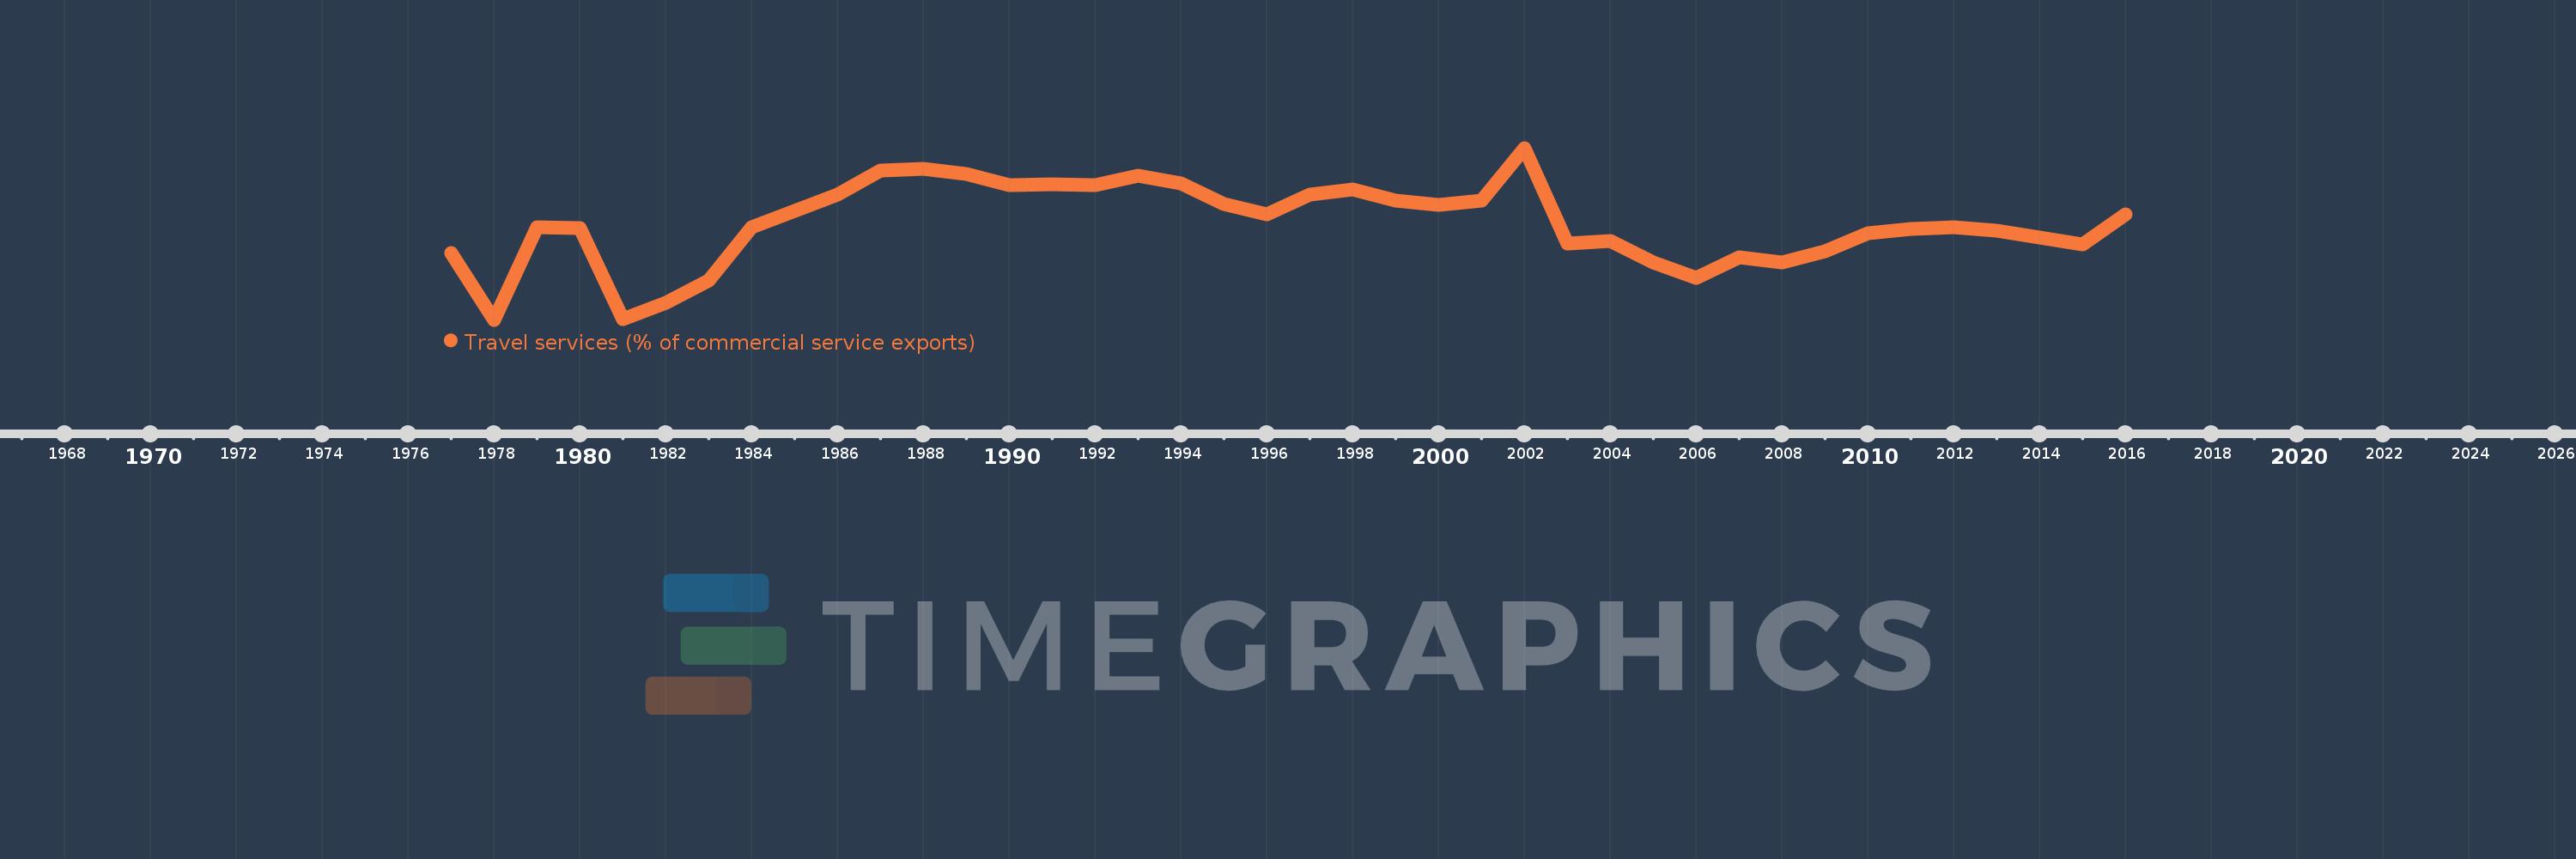
Travel services (% of commercial service exports)
2016,2015,2014,2013,2012,2011,2010,2009,2008,2007,2006,2005,2004,2003,2002,2001,2000,1999,1998,1997,1996,1995,1994,1993,1992,1991,1990,1989,1988,1987,1986,1985,1984,1983,1982,1981,1980,1979,1978,1977
This statistics in other country:
AfghanistanAlbaniaAlgeriaAngolaAntigua and BarbudaArab WorldArgentinaArmeniaArubaAustraliaAustriaAzerbaijanBahamas, TheBahrainBangladeshBarbadosBelarusBelgiumBelizeBeninBermudaBhutanBoliviaBosnia and HerzegovinaBotswanaBrazilBrunei DarussalamBulgariaBurkina FasoBurundiCabo VerdeCambodiaCameroonCanadaCaribbean small statesCentral African RepublicCentral Europe and the BalticsChadChileChinaColombiaComorosCongo, Dem. Rep.Congo, Rep.Costa RicaCote d'IvoireCroatiaCuracaoCyprusCzech RepublicDenmarkDjiboutiDominicaDominican RepublicEarly-demographic dividendEast Asia & PacificEast Asia & Pacific (excluding high income)East Asia & Pacific (IDA & IBRD countries)EcuadorEgypt, Arab Rep.El SalvadorEritreaEstoniaEthiopiaEuro areaEurope & Central AsiaEurope & Central Asia (excluding high income)Europe & Central Asia (IDA & IBRD countries)European UnionFaroe IslandsFijiFinlandFragile and conflict affected situationsFranceFrench PolynesiaGabonGambia, TheGeorgiaGermanyGhanaGreeceGrenadaGuatemalaGuineaGuinea-BissauGuyanaHaitiHeavily indebted poor countries (HIPC)High incomeHondurasHong Kong SAR, ChinaHungaryIBRD onlyIcelandIDA & IBRD totalIDA onlyIDA totalIndiaIndonesiaIran, Islamic Rep.IraqIrelandIsraelItalyJamaicaJapanJordanKazakhstanKenyaKiribatiKorea, Rep.KosovoKuwaitKyrgyz RepublicLao PDRLate-demographic dividendLatin America & Caribbean Latin America & Caribbean (excluding high income)Latin America & the Caribbean (IDA & IBRD countries)LatviaLeast developed countries: UN classificationLebanonLesothoLiberiaLibyaLithuaniaLow & middle incomeLow incomeLower middle incomeLuxembourgMacao SAR, ChinaMacedonia, FYRMadagascarMalawiMalaysiaMaldivesMaliMaltaMarshall IslandsMauritaniaMauritiusMexicoMicronesia, Fed. Sts.Middle East & North Africa (excluding high income)Middle East & North Africa (IDA & IBRD countries)Middle incomeMoldovaMongoliaMontenegroMoroccoMozambiqueMyanmarNamibiaNepalNetherlandsNew CaledoniaNew ZealandNicaraguaNigerNigeriaNorth AmericaNorwayOECD membersOmanOther small statesPacific island small statesPakistanPalauPanamaPapua New GuineaParaguayPeruPhilippinesPolandPortugalPost-demographic dividendPre-demographic dividendQatarRomaniaRussian FederationRwandaSamoaSao Tome and PrincipeSaudi ArabiaSenegalSerbiaSeychellesSierra LeoneSingaporeSint Maarten (Dutch part)Slovak RepublicSloveniaSmall statesSolomon IslandsSouth AfricaSouth AsiaSouth Asia (IDA & IBRD)South SudanSpainSri LankaSt. Kitts and NevisSt. LuciaSt. Vincent and the GrenadinesSub-Saharan Africa Sub-Saharan Africa (excluding high income)Sub-Saharan Africa (IDA & IBRD countries)SudanSurinameSwazilandSwedenSwitzerlandSyrian Arab RepublicTajikistanTanzaniaThailandTimor-LesteTogoTongaTrinidad and TobagoTunisiaTurkeyTuvaluUgandaUkraineUnited KingdomUnited StatesUpper middle incomeUruguayVanuatuVenezuela, RBWest Bank and GazaWorldYemen, Rep.ZambiaZimbabwe Timeline:
This timeline shows a graph from 1977 to 2016 of Bahamas, The. No data until 1976. Number of actual observations by date: 40.
Source name:
World Development Indicators
Source organization:
International Monetary Fund, Balance of Payments Statistics Yearbook and data files.
Categories, topics:
Private Sector, Trade
Last updated:
apr 23, 2017
Indicators value changes by year
Minimum:
81.438
jan 1, 1978
Maximum:
92.771
jan 1, 2002
At the date of observation
Value
Absolute change
Change from previous value
jan 1, 1977
85.864
+85.864
0.0%
jan 1, 1978
81.438
-4.427
-5.16%
jan 1, 1979
87.527
+6.089
7.48%
jan 1, 1980
87.492
-0.034
-0.04%
jan 1, 1981
81.464
-6.028
-6.89%
jan 1, 1982
82.571
+1.107
1.36%
jan 1, 1983
84.03
+1.459
1.77%
jan 1, 1984
87.569
+3.538
4.21%
jan 1, 1985
88.613
+1.045
1.19%
jan 1, 1986
89.717
+1.104
1.25%
jan 1, 1987
91.292
+1.575
1.76%
jan 1, 1988
91.407
+0.114
0.13%
jan 1, 1989
91.031
-0.375
-0.41%
jan 1, 1990
90.333
-0.698
-0.77%
jan 1, 1991
90.397
+0.064
0.07%
jan 1, 1992
90.328
-0.068
-0.08%
jan 1, 1993
90.92
+0.592
0.65%
jan 1, 1994
90.417
-0.503
-0.55%
jan 1, 1995
89.087
-1.331
-1.47%
jan 1, 1996
88.388
-0.698
-0.78%
jan 1, 1997
89.707
+1.318
1.49%
jan 1, 1998
90.013
+0.307
0.34%
jan 1, 1999
89.273
-0.741
-0.82%
jan 1, 2000
89.032
-0.241
-0.27%
jan 1, 2001
89.321
+0.289
0.32%
jan 1, 2002
92.771
+3.45
3.86%
jan 1, 2003
86.457
-6.314
-6.81%
jan 1, 2004
86.648
+0.192
0.22%
jan 1, 2005
85.24
-1.408
-1.62%
jan 1, 2006
84.176
-1.064
-1.25%
jan 1, 2007
85.571
+1.395
1.66%
jan 1, 2008
85.223
-0.348
-0.41%
jan 1, 2009
85.978
+0.756
0.89%
jan 1, 2010
87.147
+1.168
1.36%
jan 1, 2011
87.404
+0.257
0.3%
jan 1, 2012
87.566
+0.162
0.19%
jan 1, 2013
87.292
-0.275
-0.31%
jan 1, 2014
86.847
-0.445
-0.51%
jan 1, 2015
86.417
-0.43
-0.5%
jan 1, 2016
88.376
+1.959
2.27%
Ranking of countries by current statistics by years


Comments: