29
/
en
AIzaSyAYiBZKx7MnpbEhh9jyipgxe19OcubqV5w
April 1, 2024
251493
St. Lucia
LCA
true
2
1
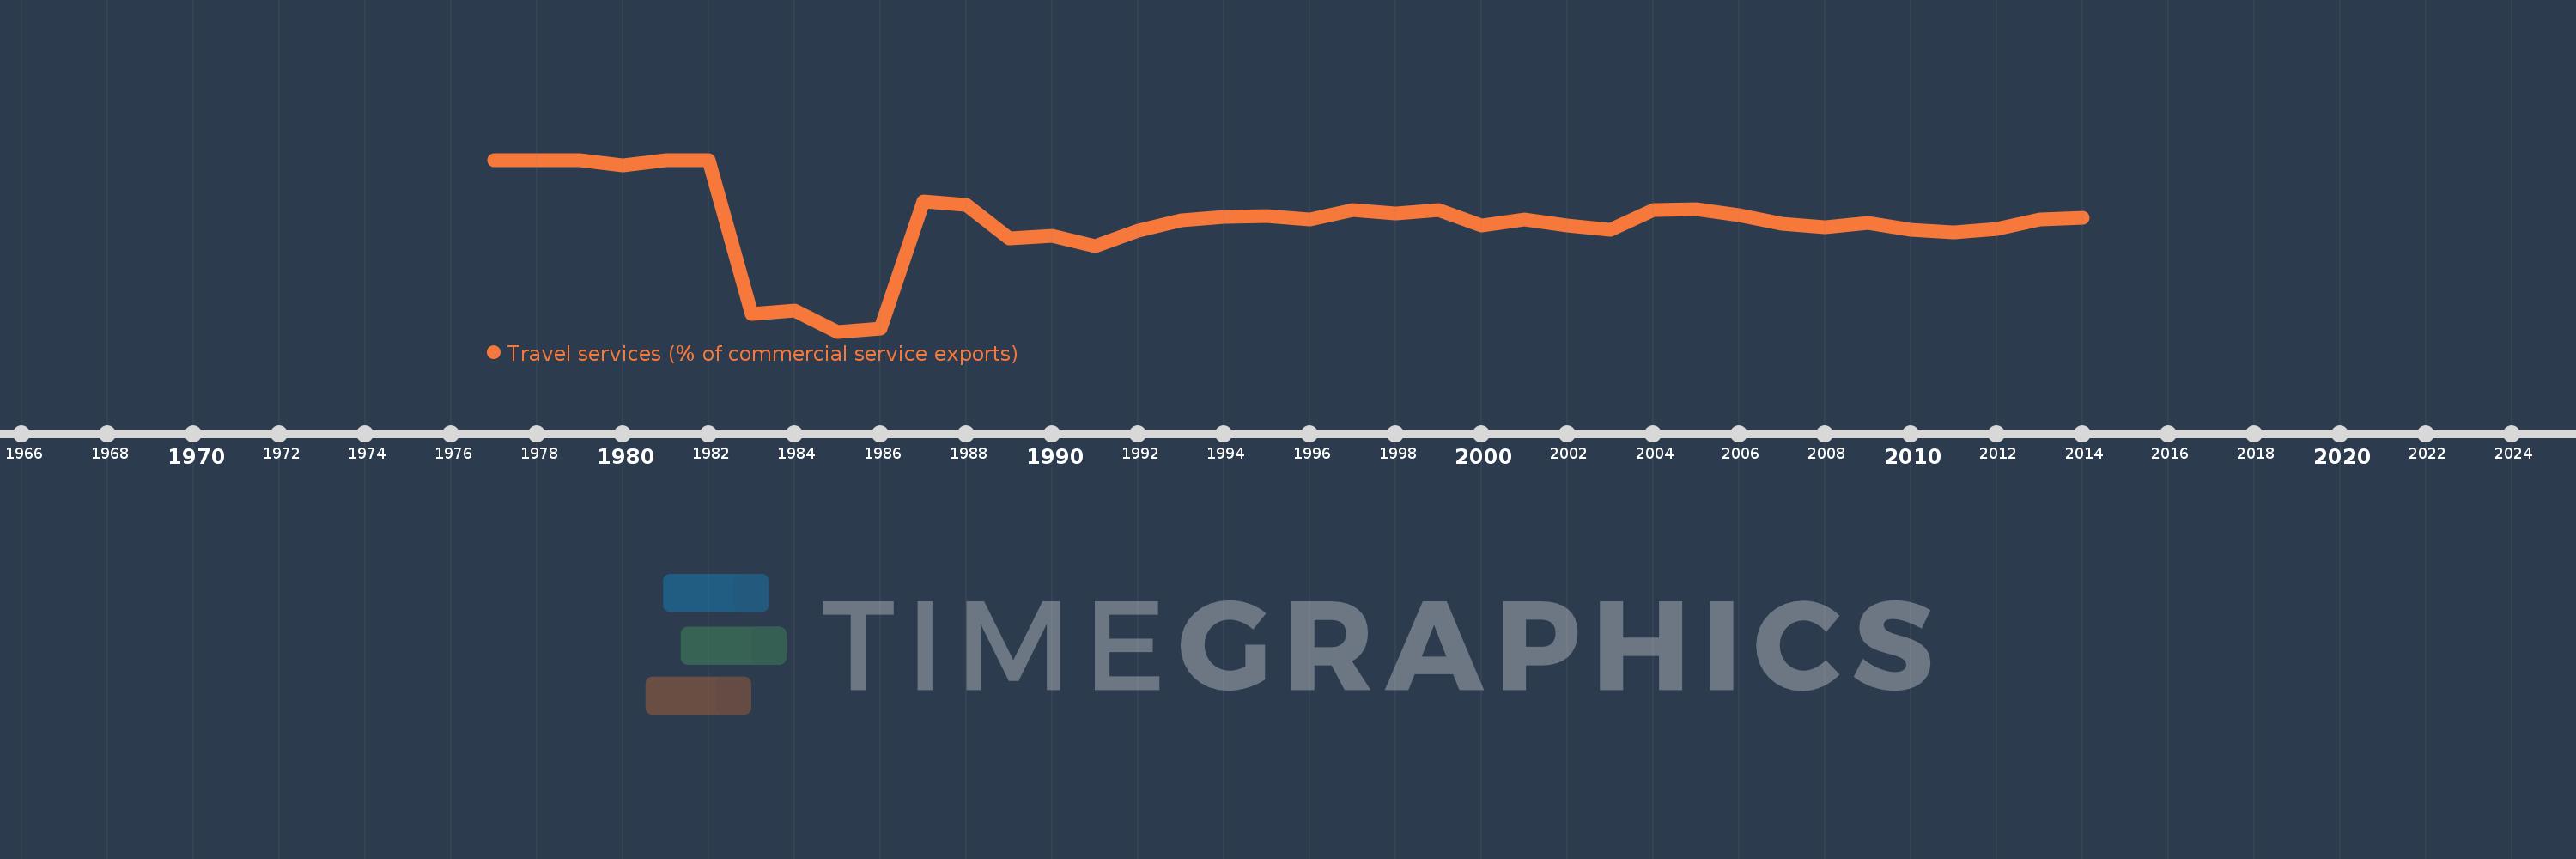
Travel services (% of commercial service exports)
2014,2013,2012,2011,2010,2009,2008,2007,2006,2005,2004,2003,2002,2001,2000,1999,1998,1997,1996,1995,1994,1993,1992,1991,1990,1989,1988,1987,1986,1985,1984,1983,1982,1981,1980,1979,1978,1977
This statistics in other country:
AfghanistanAlbaniaAlgeriaAngolaAntigua and BarbudaArab WorldArgentinaArmeniaArubaAustraliaAustriaAzerbaijanBahamas, TheBahrainBangladeshBarbadosBelarusBelgiumBelizeBeninBermudaBhutanBoliviaBosnia and HerzegovinaBotswanaBrazilBrunei DarussalamBulgariaBurkina FasoBurundiCabo VerdeCambodiaCameroonCanadaCaribbean small statesCentral African RepublicCentral Europe and the BalticsChadChileChinaColombiaComorosCongo, Dem. Rep.Congo, Rep.Costa RicaCote d'IvoireCroatiaCuracaoCyprusCzech RepublicDenmarkDjiboutiDominicaDominican RepublicEarly-demographic dividendEast Asia & PacificEast Asia & Pacific (excluding high income)East Asia & Pacific (IDA & IBRD countries)EcuadorEgypt, Arab Rep.El SalvadorEritreaEstoniaEthiopiaEuro areaEurope & Central AsiaEurope & Central Asia (excluding high income)Europe & Central Asia (IDA & IBRD countries)European UnionFaroe IslandsFijiFinlandFragile and conflict affected situationsFranceFrench PolynesiaGabonGambia, TheGeorgiaGermanyGhanaGreeceGrenadaGuatemalaGuineaGuinea-BissauGuyanaHaitiHeavily indebted poor countries (HIPC)High incomeHondurasHong Kong SAR, ChinaHungaryIBRD onlyIcelandIDA & IBRD totalIDA onlyIDA totalIndiaIndonesiaIran, Islamic Rep.IraqIrelandIsraelItalyJamaicaJapanJordanKazakhstanKenyaKiribatiKorea, Rep.KosovoKuwaitKyrgyz RepublicLao PDRLate-demographic dividendLatin America & Caribbean Latin America & Caribbean (excluding high income)Latin America & the Caribbean (IDA & IBRD countries)LatviaLeast developed countries: UN classificationLebanonLesothoLiberiaLibyaLithuaniaLow & middle incomeLow incomeLower middle incomeLuxembourgMacao SAR, ChinaMacedonia, FYRMadagascarMalawiMalaysiaMaldivesMaliMaltaMarshall IslandsMauritaniaMauritiusMexicoMicronesia, Fed. Sts.Middle East & North Africa (excluding high income)Middle East & North Africa (IDA & IBRD countries)Middle incomeMoldovaMongoliaMontenegroMoroccoMozambiqueMyanmarNamibiaNepalNetherlandsNew CaledoniaNew ZealandNicaraguaNigerNigeriaNorth AmericaNorwayOECD membersOmanOther small statesPacific island small statesPakistanPalauPanamaPapua New GuineaParaguayPeruPhilippinesPolandPortugalPost-demographic dividendPre-demographic dividendQatarRomaniaRussian FederationRwandaSamoaSao Tome and PrincipeSaudi ArabiaSenegalSerbiaSeychellesSierra LeoneSingaporeSint Maarten (Dutch part)Slovak RepublicSloveniaSmall statesSolomon IslandsSouth AfricaSouth AsiaSouth Asia (IDA & IBRD)South SudanSpainSri LankaSt. Kitts and NevisSt. LuciaSt. Vincent and the GrenadinesSub-Saharan Africa Sub-Saharan Africa (excluding high income)Sub-Saharan Africa (IDA & IBRD countries)SudanSurinameSwazilandSwedenSwitzerlandSyrian Arab RepublicTajikistanTanzaniaThailandTimor-LesteTogoTongaTrinidad and TobagoTunisiaTurkeyTuvaluUgandaUkraineUnited KingdomUnited StatesUpper middle incomeUruguayVanuatuVenezuela, RBWest Bank and GazaWorldYemen, Rep.ZambiaZimbabwe Timeline:
This timeline shows a graph from 1977 to 2014 of St. Lucia. No data until 1976. Number of actual observations by date: 38.
Source name:
World Development Indicators
Source organization:
International Monetary Fund, Balance of Payments Statistics Yearbook and data files.
Categories, topics:
Private Sector, Trade
Last updated:
apr 23, 2017
Indicators value changes by year
Minimum:
62.188
jan 1, 1985
At the date of observation
Value
Absolute change
Change from previous value
jan 1, 1977
100.0
+100.0
0.0%
jan 1, 1978
100.0
0.0
0.0%
jan 1, 1979
100.0
0.0
0.0%
jan 1, 1980
98.817
-1.183
-1.18%
jan 1, 1981
100.0
+1.183
1.2%
jan 1, 1982
100.0
0.0
0.0%
jan 1, 1983
65.996
-34.004
-34.0%
jan 1, 1984
66.79
+0.794
1.2%
jan 1, 1985
62.188
-4.602
-6.89%
jan 1, 1986
62.878
+0.69
1.11%
jan 1, 1987
90.757
+27.879
44.34%
jan 1, 1988
90.118
-0.638
-0.7%
jan 1, 1989
82.724
-7.394
-8.2%
jan 1, 1990
83.271
+0.547
0.66%
jan 1, 1991
81.009
-2.262
-2.72%
jan 1, 1992
84.355
+3.345
4.13%
jan 1, 1993
86.596
+2.242
2.66%
jan 1, 1994
87.454
+0.858
0.99%
jan 1, 1995
87.531
+0.077
0.09%
jan 1, 1996
86.906
-0.625
-0.71%
jan 1, 1997
89.03
+2.123
2.44%
jan 1, 1998
88.183
-0.847
-0.95%
jan 1, 1999
89.034
+0.852
0.97%
jan 1, 2000
85.578
-3.456
-3.88%
jan 1, 2001
86.945
+1.367
1.6%
jan 1, 2002
85.607
-1.338
-1.54%
jan 1, 2003
84.531
-1.077
-1.26%
jan 1, 2004
89.019
+4.489
5.31%
jan 1, 2005
89.079
+0.06
0.07%
jan 1, 2006
87.849
-1.231
-1.38%
jan 1, 2007
86.003
-1.846
-2.1%
jan 1, 2008
85.199
-0.805
-0.94%
jan 1, 2009
86.017
+0.819
0.96%
jan 1, 2010
84.553
-1.464
-1.7%
jan 1, 2011
83.995
-0.559
-0.66%
jan 1, 2012
84.758
+0.763
0.91%
jan 1, 2013
86.768
+2.01
2.37%
jan 1, 2014
87.196
+0.429
0.49%
Ranking of countries by current statistics by years


Comments: