29
/
en
AIzaSyAYiBZKx7MnpbEhh9jyipgxe19OcubqV5w
April 1, 2024
202413
Morocco
MAR
true
2
1
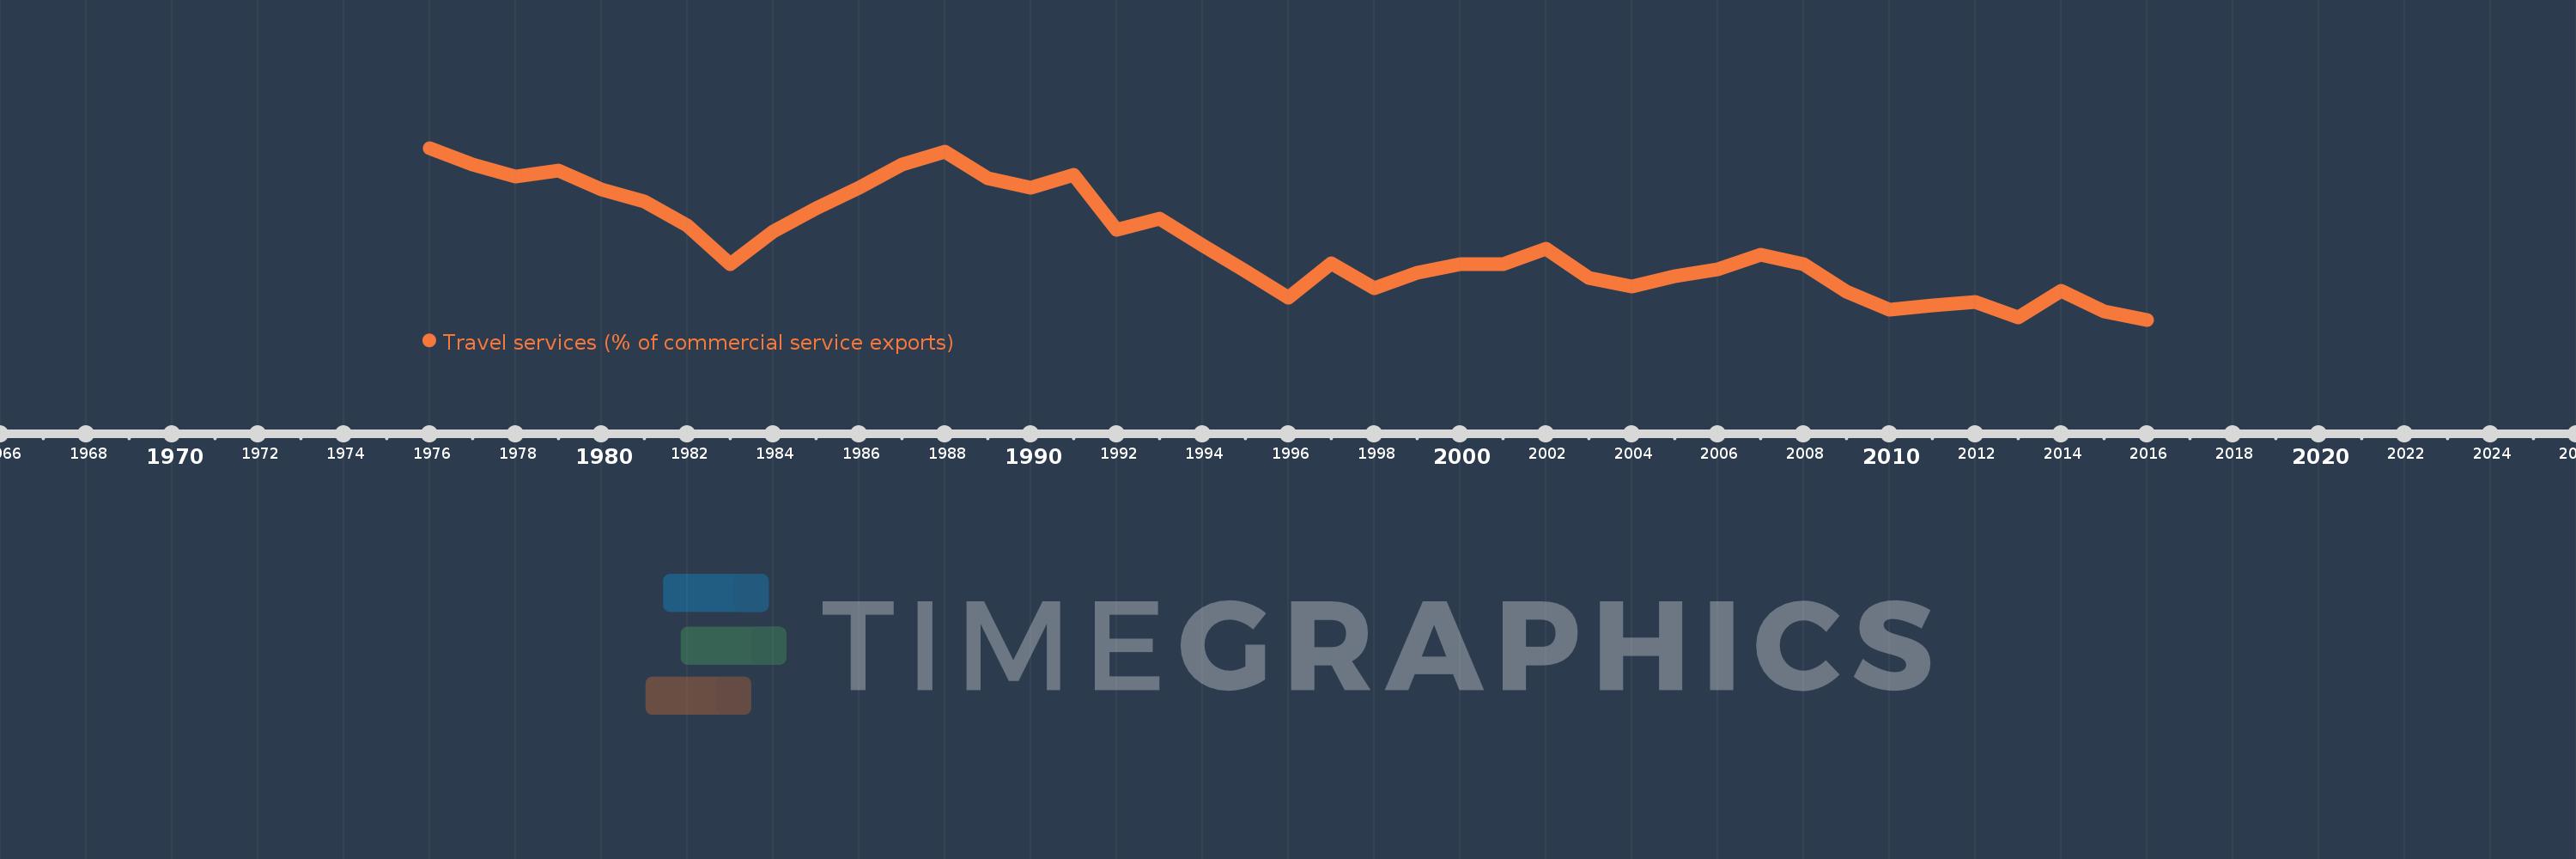
Travel services (% of commercial service exports)
2016,2015,2014,2013,2012,2011,2010,2009,2008,2007,2006,2005,2004,2003,2002,2001,2000,1999,1998,1997,1996,1995,1994,1993,1992,1991,1990,1989,1988,1987,1986,1985,1984,1983,1982,1981,1980,1979,1978,1977,1976
This statistics in other country:
AfghanistanAlbaniaAlgeriaAngolaAntigua and BarbudaArab WorldArgentinaArmeniaArubaAustraliaAustriaAzerbaijanBahamas, TheBahrainBangladeshBarbadosBelarusBelgiumBelizeBeninBermudaBhutanBoliviaBosnia and HerzegovinaBotswanaBrazilBrunei DarussalamBulgariaBurkina FasoBurundiCabo VerdeCambodiaCameroonCanadaCaribbean small statesCentral African RepublicCentral Europe and the BalticsChadChileChinaColombiaComorosCongo, Dem. Rep.Congo, Rep.Costa RicaCote d'IvoireCroatiaCuracaoCyprusCzech RepublicDenmarkDjiboutiDominicaDominican RepublicEarly-demographic dividendEast Asia & PacificEast Asia & Pacific (excluding high income)East Asia & Pacific (IDA & IBRD countries)EcuadorEgypt, Arab Rep.El SalvadorEritreaEstoniaEthiopiaEuro areaEurope & Central AsiaEurope & Central Asia (excluding high income)Europe & Central Asia (IDA & IBRD countries)European UnionFaroe IslandsFijiFinlandFragile and conflict affected situationsFranceFrench PolynesiaGabonGambia, TheGeorgiaGermanyGhanaGreeceGrenadaGuatemalaGuineaGuinea-BissauGuyanaHaitiHeavily indebted poor countries (HIPC)High incomeHondurasHong Kong SAR, ChinaHungaryIBRD onlyIcelandIDA & IBRD totalIDA onlyIDA totalIndiaIndonesiaIran, Islamic Rep.IraqIrelandIsraelItalyJamaicaJapanJordanKazakhstanKenyaKiribatiKorea, Rep.KosovoKuwaitKyrgyz RepublicLao PDRLate-demographic dividendLatin America & Caribbean Latin America & Caribbean (excluding high income)Latin America & the Caribbean (IDA & IBRD countries)LatviaLeast developed countries: UN classificationLebanonLesothoLiberiaLibyaLithuaniaLow & middle incomeLow incomeLower middle incomeLuxembourgMacao SAR, ChinaMacedonia, FYRMadagascarMalawiMalaysiaMaldivesMaliMaltaMarshall IslandsMauritaniaMauritiusMexicoMicronesia, Fed. Sts.Middle East & North Africa (excluding high income)Middle East & North Africa (IDA & IBRD countries)Middle incomeMoldovaMongoliaMontenegroMoroccoMozambiqueMyanmarNamibiaNepalNetherlandsNew CaledoniaNew ZealandNicaraguaNigerNigeriaNorth AmericaNorwayOECD membersOmanOther small statesPacific island small statesPakistanPalauPanamaPapua New GuineaParaguayPeruPhilippinesPolandPortugalPost-demographic dividendPre-demographic dividendQatarRomaniaRussian FederationRwandaSamoaSao Tome and PrincipeSaudi ArabiaSenegalSerbiaSeychellesSierra LeoneSingaporeSint Maarten (Dutch part)Slovak RepublicSloveniaSmall statesSolomon IslandsSouth AfricaSouth AsiaSouth Asia (IDA & IBRD)South SudanSpainSri LankaSt. Kitts and NevisSt. LuciaSt. Vincent and the GrenadinesSub-Saharan Africa Sub-Saharan Africa (excluding high income)Sub-Saharan Africa (IDA & IBRD countries)SudanSurinameSwazilandSwedenSwitzerlandSyrian Arab RepublicTajikistanTanzaniaThailandTimor-LesteTogoTongaTrinidad and TobagoTunisiaTurkeyTuvaluUgandaUkraineUnited KingdomUnited StatesUpper middle incomeUruguayVanuatuVenezuela, RBWest Bank and GazaWorldYemen, Rep.ZambiaZimbabwe Timeline:
This timeline shows a graph from 1976 to 2016 of Morocco. No data until 1975. Number of actual observations by date: 41.
Source name:
World Development Indicators
Source organization:
International Monetary Fund, Balance of Payments Statistics Yearbook and data files.
Categories, topics:
Private Sector, Trade
Last updated:
apr 23, 2017
Indicators value changes by year
Minimum:
44.386
jan 1, 2016
Maximum:
72.786
jan 1, 1976
At the date of observation
Value
Absolute change
Change from previous value
jan 1, 1976
72.786
+72.786
0.0%
jan 1, 1977
70.064
-2.722
-3.74%
jan 1, 1978
68.017
-2.047
-2.92%
jan 1, 1979
68.999
+0.982
1.44%
jan 1, 1980
65.886
-3.113
-4.51%
jan 1, 1981
63.971
-1.916
-2.91%
jan 1, 1982
59.959
-4.012
-6.27%
jan 1, 1983
53.541
-6.418
-10.7%
jan 1, 1984
59.027
+5.486
10.25%
jan 1, 1985
62.795
+3.768
6.38%
jan 1, 1986
66.256
+3.462
5.51%
jan 1, 1987
70.102
+3.845
5.8%
jan 1, 1988
72.122
+2.02
2.88%
jan 1, 1989
67.814
-4.308
-5.97%
jan 1, 1990
66.207
-1.607
-2.37%
jan 1, 1991
68.39
+2.183
3.3%
jan 1, 1992
59.288
-9.102
-13.31%
jan 1, 1993
61.131
+1.843
3.11%
jan 1, 1994
56.667
-4.464
-7.3%
jan 1, 1995
52.48
-4.187
-7.39%
jan 1, 1996
48.003
-4.477
-8.53%
jan 1, 1997
53.646
+5.642
11.75%
jan 1, 1998
49.572
-4.074
-7.59%
jan 1, 1999
52.167
+2.595
5.24%
jan 1, 2000
53.549
+1.381
2.65%
jan 1, 2001
53.518
-0.031
-0.06%
jan 1, 2002
56.137
+2.62
4.89%
jan 1, 2003
51.248
-4.889
-8.71%
jan 1, 2004
49.921
-1.327
-2.59%
jan 1, 2005
51.551
+1.63
3.27%
jan 1, 2006
52.77
+1.218
2.36%
jan 1, 2007
55.116
+2.346
4.45%
jan 1, 2008
53.633
-1.483
-2.69%
jan 1, 2009
49.038
-4.595
-8.57%
jan 1, 2010
46.052
-2.987
-6.09%
jan 1, 2011
46.769
+0.717
1.56%
jan 1, 2012
47.273
+0.504
1.08%
jan 1, 2013
44.808
-2.465
-5.21%
jan 1, 2014
49.166
+4.358
9.73%
jan 1, 2015
45.776
-3.39
-6.89%
jan 1, 2016
44.386
-1.39
-3.04%
Ranking of countries by current statistics by years


Comments: