29
/
en
AIzaSyAYiBZKx7MnpbEhh9jyipgxe19OcubqV5w
April 1, 2024
188597
Malaysia
MYS
true
2
1
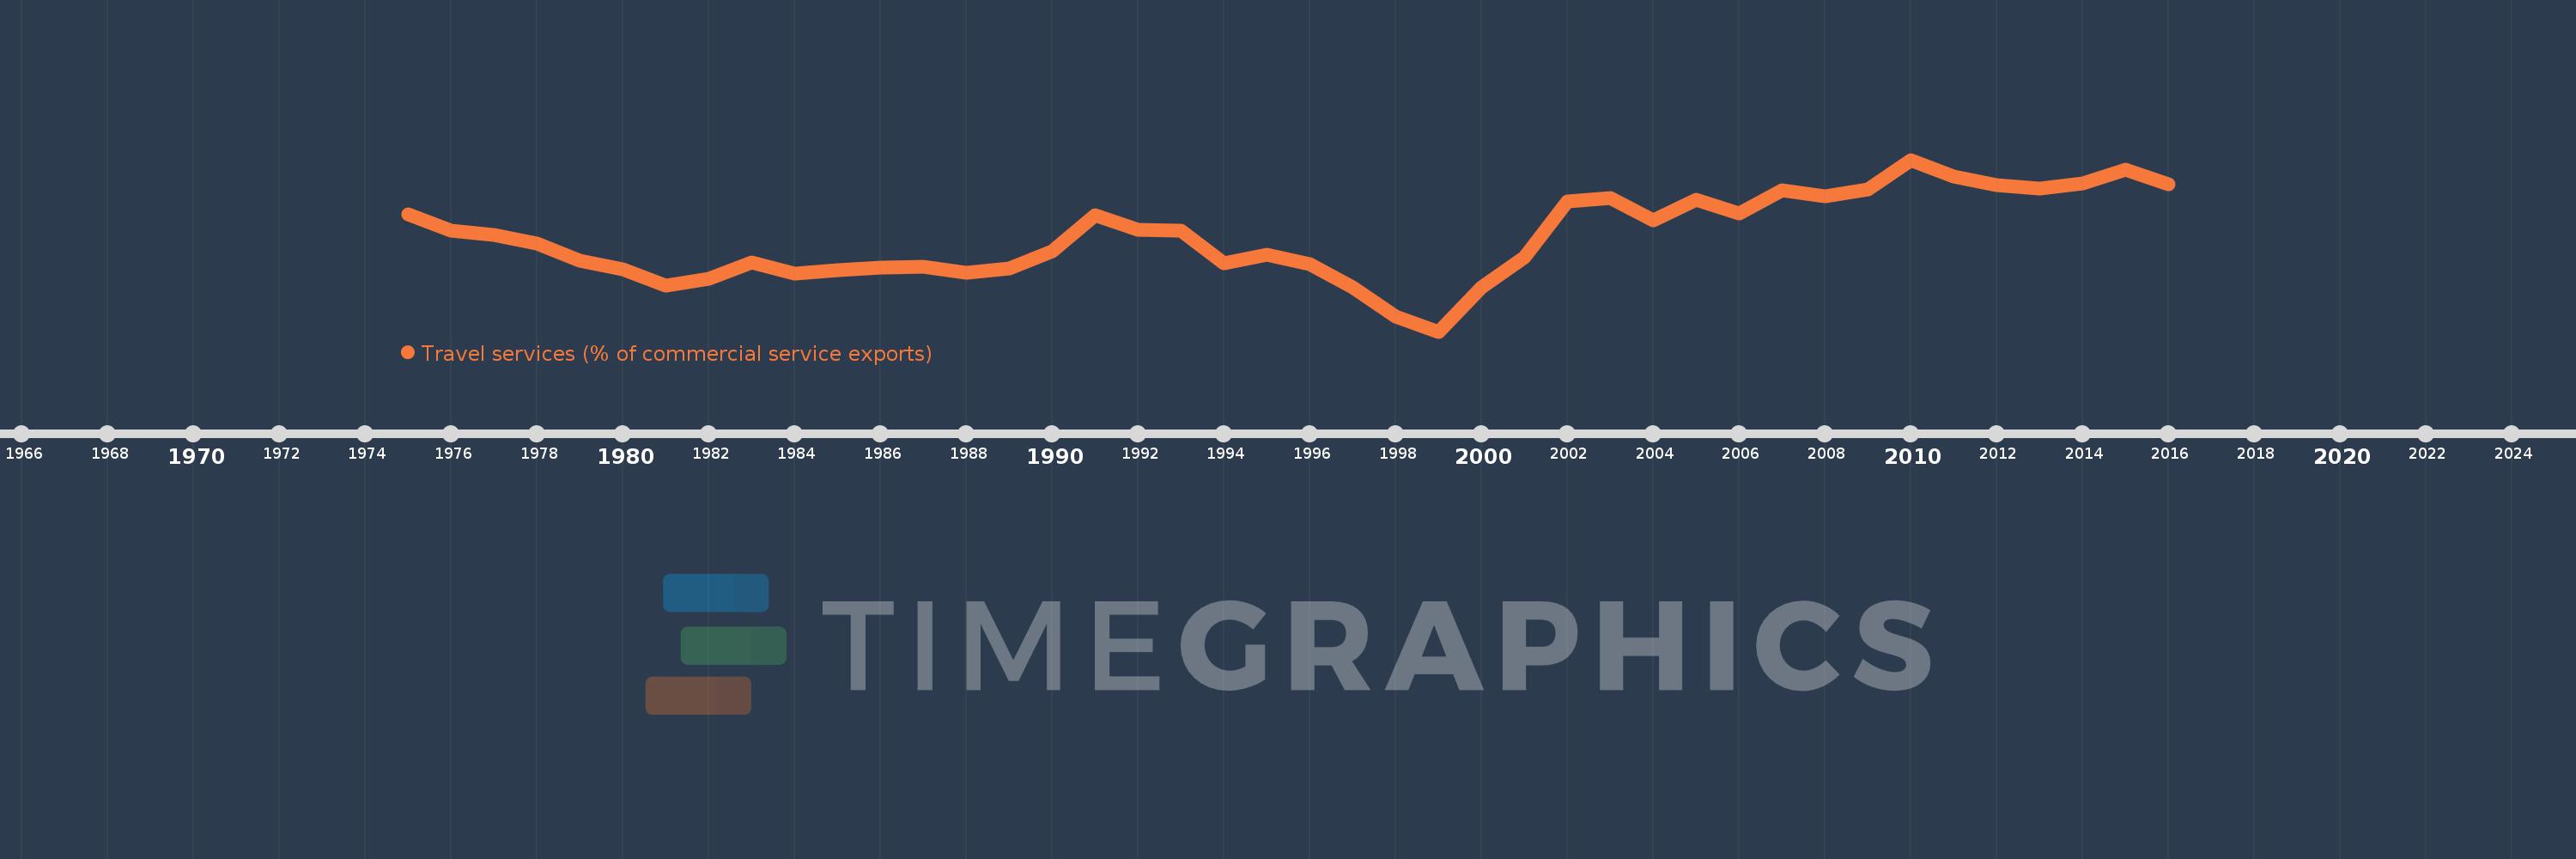
Travel services (% of commercial service exports)
2016,2015,2014,2013,2012,2011,2010,2009,2008,2007,2006,2005,2004,2003,2002,2001,2000,1999,1998,1997,1996,1995,1994,1993,1992,1991,1990,1989,1988,1987,1986,1985,1984,1983,1982,1981,1980,1979,1978,1977,1976,1975
This statistics in other country:
AfghanistanAlbaniaAlgeriaAngolaAntigua and BarbudaArab WorldArgentinaArmeniaArubaAustraliaAustriaAzerbaijanBahamas, TheBahrainBangladeshBarbadosBelarusBelgiumBelizeBeninBermudaBhutanBoliviaBosnia and HerzegovinaBotswanaBrazilBrunei DarussalamBulgariaBurkina FasoBurundiCabo VerdeCambodiaCameroonCanadaCaribbean small statesCentral African RepublicCentral Europe and the BalticsChadChileChinaColombiaComorosCongo, Dem. Rep.Congo, Rep.Costa RicaCote d'IvoireCroatiaCuracaoCyprusCzech RepublicDenmarkDjiboutiDominicaDominican RepublicEarly-demographic dividendEast Asia & PacificEast Asia & Pacific (excluding high income)East Asia & Pacific (IDA & IBRD countries)EcuadorEgypt, Arab Rep.El SalvadorEritreaEstoniaEthiopiaEuro areaEurope & Central AsiaEurope & Central Asia (excluding high income)Europe & Central Asia (IDA & IBRD countries)European UnionFaroe IslandsFijiFinlandFragile and conflict affected situationsFranceFrench PolynesiaGabonGambia, TheGeorgiaGermanyGhanaGreeceGrenadaGuatemalaGuineaGuinea-BissauGuyanaHaitiHeavily indebted poor countries (HIPC)High incomeHondurasHong Kong SAR, ChinaHungaryIBRD onlyIcelandIDA & IBRD totalIDA onlyIDA totalIndiaIndonesiaIran, Islamic Rep.IraqIrelandIsraelItalyJamaicaJapanJordanKazakhstanKenyaKiribatiKorea, Rep.KosovoKuwaitKyrgyz RepublicLao PDRLate-demographic dividendLatin America & Caribbean Latin America & Caribbean (excluding high income)Latin America & the Caribbean (IDA & IBRD countries)LatviaLeast developed countries: UN classificationLebanonLesothoLiberiaLibyaLithuaniaLow & middle incomeLow incomeLower middle incomeLuxembourgMacao SAR, ChinaMacedonia, FYRMadagascarMalawiMalaysiaMaldivesMaliMaltaMarshall IslandsMauritaniaMauritiusMexicoMicronesia, Fed. Sts.Middle East & North Africa (excluding high income)Middle East & North Africa (IDA & IBRD countries)Middle incomeMoldovaMongoliaMontenegroMoroccoMozambiqueMyanmarNamibiaNepalNetherlandsNew CaledoniaNew ZealandNicaraguaNigerNigeriaNorth AmericaNorwayOECD membersOmanOther small statesPacific island small statesPakistanPalauPanamaPapua New GuineaParaguayPeruPhilippinesPolandPortugalPost-demographic dividendPre-demographic dividendQatarRomaniaRussian FederationRwandaSamoaSao Tome and PrincipeSaudi ArabiaSenegalSerbiaSeychellesSierra LeoneSingaporeSint Maarten (Dutch part)Slovak RepublicSloveniaSmall statesSolomon IslandsSouth AfricaSouth AsiaSouth Asia (IDA & IBRD)South SudanSpainSri LankaSt. Kitts and NevisSt. LuciaSt. Vincent and the GrenadinesSub-Saharan Africa Sub-Saharan Africa (excluding high income)Sub-Saharan Africa (IDA & IBRD countries)SudanSurinameSwazilandSwedenSwitzerlandSyrian Arab RepublicTajikistanTanzaniaThailandTimor-LesteTogoTongaTrinidad and TobagoTunisiaTurkeyTuvaluUgandaUkraineUnited KingdomUnited StatesUpper middle incomeUruguayVanuatuVenezuela, RBWest Bank and GazaWorldYemen, Rep.ZambiaZimbabwe Timeline:
This timeline shows a graph from 1975 to 2016 of Malaysia. No data until 1974. Number of actual observations by date: 42.
Source name:
World Development Indicators
Source organization:
International Monetary Fund, Balance of Payments Statistics Yearbook and data files.
Categories, topics:
Private Sector, Trade
Last updated:
apr 23, 2017
Indicators value changes by year
Minimum:
20.881
jan 1, 1999
Maximum:
55.922
jan 1, 2010
At the date of observation
Value
Absolute change
Change from previous value
jan 1, 1975
44.805
+44.805
0.0%
jan 1, 1976
41.446
-3.359
-7.5%
jan 1, 1977
40.607
-0.839
-2.02%
jan 1, 1978
38.793
-1.814
-4.47%
jan 1, 1979
35.418
-3.375
-8.7%
jan 1, 1980
33.657
-1.761
-4.97%
jan 1, 1981
30.334
-3.323
-9.87%
jan 1, 1982
31.585
+1.251
4.12%
jan 1, 1983
35.023
+3.439
10.89%
jan 1, 1984
32.765
-2.258
-6.45%
jan 1, 1985
33.326
+0.561
1.71%
jan 1, 1986
33.897
+0.571
1.71%
jan 1, 1987
34.129
+0.233
0.69%
jan 1, 1988
32.876
-1.253
-3.67%
jan 1, 1989
33.735
+0.859
2.61%
jan 1, 1990
37.292
+3.557
10.55%
jan 1, 1991
44.674
+7.382
19.79%
jan 1, 1992
41.616
-3.059
-6.85%
jan 1, 1993
41.554
-0.062
-0.15%
jan 1, 1994
34.798
-6.756
-16.26%
jan 1, 1995
36.596
+1.798
5.17%
jan 1, 1996
34.696
-1.9
-5.19%
jan 1, 1997
29.914
-4.781
-13.78%
jan 1, 1998
24.026
-5.888
-19.68%
jan 1, 1999
20.881
-3.145
-13.09%
jan 1, 2000
29.964
+9.083
43.5%
jan 1, 2001
36.008
+6.044
20.17%
jan 1, 2002
47.508
+11.5
31.94%
jan 1, 2003
48.115
+0.607
1.28%
jan 1, 2004
43.64
-4.475
-9.3%
jan 1, 2005
47.693
+4.053
9.29%
jan 1, 2006
45.048
-2.645
-5.55%
jan 1, 2007
49.721
+4.673
10.37%
jan 1, 2008
48.466
-1.254
-2.52%
jan 1, 2009
49.793
+1.327
2.74%
jan 1, 2010
55.922
+6.128
12.31%
jan 1, 2011
52.481
-3.441
-6.15%
jan 1, 2012
50.706
-1.775
-3.38%
jan 1, 2013
50.004
-0.701
-1.38%
jan 1, 2014
51.184
+1.18
2.36%
jan 1, 2015
53.845
+2.661
5.2%
jan 1, 2016
50.933
-2.912
-5.41%
Ranking of countries by current statistics by years


Comments: