29
/
en
AIzaSyAYiBZKx7MnpbEhh9jyipgxe19OcubqV5w
April 1, 2024
238842
Seychelles
SYC
true
2
1
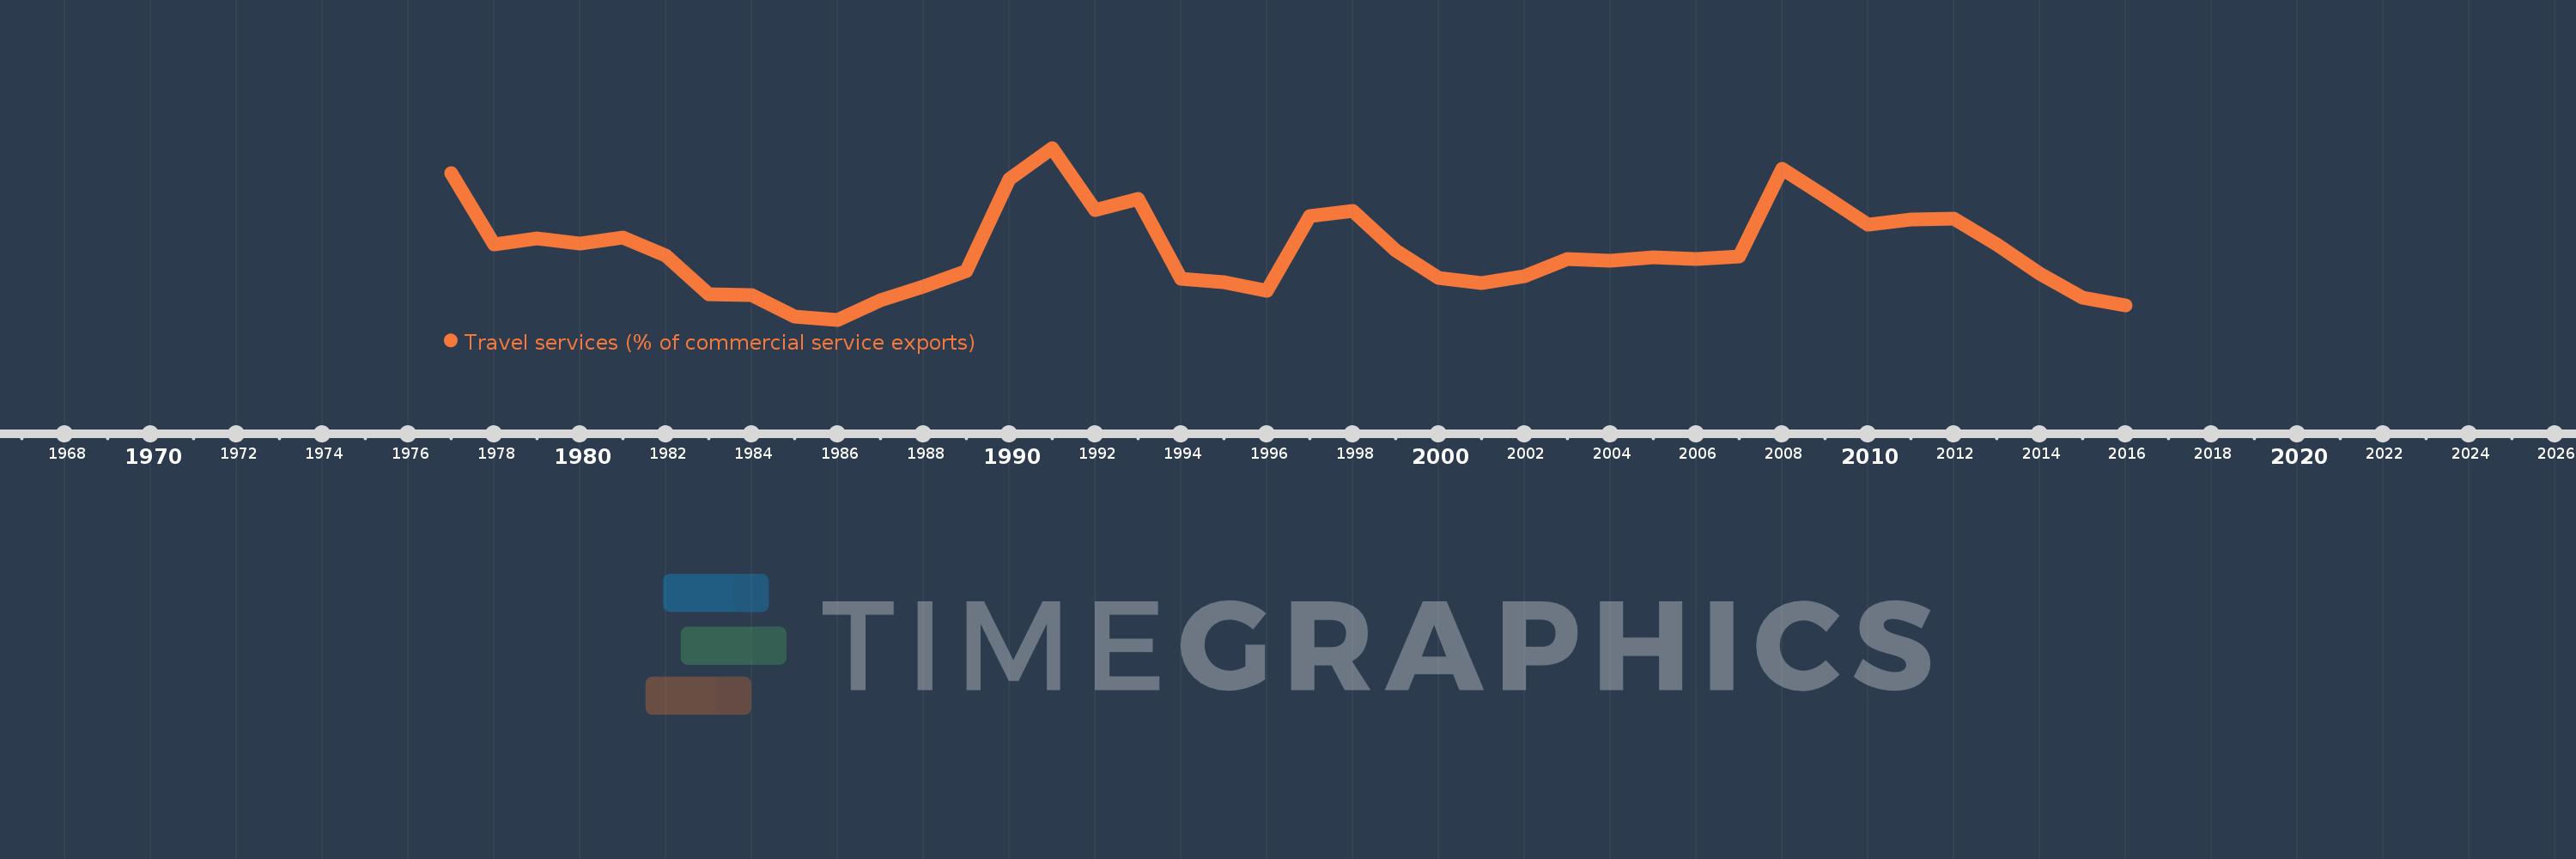
Travel services (% of commercial service exports)
2016,2015,2014,2013,2012,2011,2010,2009,2008,2007,2006,2005,2004,2003,2002,2001,2000,1999,1998,1997,1996,1995,1994,1993,1992,1991,1990,1989,1988,1987,1986,1985,1984,1983,1982,1981,1980,1979,1978,1977
This statistics in other country:
AfghanistanAlbaniaAlgeriaAngolaAntigua and BarbudaArab WorldArgentinaArmeniaArubaAustraliaAustriaAzerbaijanBahamas, TheBahrainBangladeshBarbadosBelarusBelgiumBelizeBeninBermudaBhutanBoliviaBosnia and HerzegovinaBotswanaBrazilBrunei DarussalamBulgariaBurkina FasoBurundiCabo VerdeCambodiaCameroonCanadaCaribbean small statesCentral African RepublicCentral Europe and the BalticsChadChileChinaColombiaComorosCongo, Dem. Rep.Congo, Rep.Costa RicaCote d'IvoireCroatiaCuracaoCyprusCzech RepublicDenmarkDjiboutiDominicaDominican RepublicEarly-demographic dividendEast Asia & PacificEast Asia & Pacific (excluding high income)East Asia & Pacific (IDA & IBRD countries)EcuadorEgypt, Arab Rep.El SalvadorEritreaEstoniaEthiopiaEuro areaEurope & Central AsiaEurope & Central Asia (excluding high income)Europe & Central Asia (IDA & IBRD countries)European UnionFaroe IslandsFijiFinlandFragile and conflict affected situationsFranceFrench PolynesiaGabonGambia, TheGeorgiaGermanyGhanaGreeceGrenadaGuatemalaGuineaGuinea-BissauGuyanaHaitiHeavily indebted poor countries (HIPC)High incomeHondurasHong Kong SAR, ChinaHungaryIBRD onlyIcelandIDA & IBRD totalIDA onlyIDA totalIndiaIndonesiaIran, Islamic Rep.IraqIrelandIsraelItalyJamaicaJapanJordanKazakhstanKenyaKiribatiKorea, Rep.KosovoKuwaitKyrgyz RepublicLao PDRLate-demographic dividendLatin America & Caribbean Latin America & Caribbean (excluding high income)Latin America & the Caribbean (IDA & IBRD countries)LatviaLeast developed countries: UN classificationLebanonLesothoLiberiaLibyaLithuaniaLow & middle incomeLow incomeLower middle incomeLuxembourgMacao SAR, ChinaMacedonia, FYRMadagascarMalawiMalaysiaMaldivesMaliMaltaMarshall IslandsMauritaniaMauritiusMexicoMicronesia, Fed. Sts.Middle East & North Africa (excluding high income)Middle East & North Africa (IDA & IBRD countries)Middle incomeMoldovaMongoliaMontenegroMoroccoMozambiqueMyanmarNamibiaNepalNetherlandsNew CaledoniaNew ZealandNicaraguaNigerNigeriaNorth AmericaNorwayOECD membersOmanOther small statesPacific island small statesPakistanPalauPanamaPapua New GuineaParaguayPeruPhilippinesPolandPortugalPost-demographic dividendPre-demographic dividendQatarRomaniaRussian FederationRwandaSamoaSao Tome and PrincipeSaudi ArabiaSenegalSerbiaSeychellesSierra LeoneSingaporeSint Maarten (Dutch part)Slovak RepublicSloveniaSmall statesSolomon IslandsSouth AfricaSouth AsiaSouth Asia (IDA & IBRD)South SudanSpainSri LankaSt. Kitts and NevisSt. LuciaSt. Vincent and the GrenadinesSub-Saharan Africa Sub-Saharan Africa (excluding high income)Sub-Saharan Africa (IDA & IBRD countries)SudanSurinameSwazilandSwedenSwitzerlandSyrian Arab RepublicTajikistanTanzaniaThailandTimor-LesteTogoTongaTrinidad and TobagoTunisiaTurkeyTuvaluUgandaUkraineUnited KingdomUnited StatesUpper middle incomeUruguayVanuatuVenezuela, RBWest Bank and GazaWorldYemen, Rep.ZambiaZimbabwe Timeline:
This timeline shows a graph from 1977 to 2016 of Seychelles. No data until 1976. Number of actual observations by date: 40.
Source name:
World Development Indicators
Source organization:
International Monetary Fund, Balance of Payments Statistics Yearbook and data files.
Categories, topics:
Private Sector, Trade
Last updated:
apr 23, 2017
Indicators value changes by year
Minimum:
44.218
jan 1, 1986
Maximum:
75.218
jan 1, 1991
At the date of observation
Value
Absolute change
Change from previous value
jan 1, 1977
70.603
+70.603
0.0%
jan 1, 1978
57.778
-12.826
-18.17%
jan 1, 1979
58.866
+1.089
1.88%
jan 1, 1980
58.015
-0.851
-1.45%
jan 1, 1981
58.978
+0.963
1.66%
jan 1, 1982
55.857
-3.122
-5.29%
jan 1, 1983
48.797
-7.059
-12.64%
jan 1, 1984
48.63
-0.167
-0.34%
jan 1, 1985
44.727
-3.903
-8.03%
jan 1, 1986
44.218
-0.509
-1.14%
jan 1, 1987
47.811
+3.592
8.12%
jan 1, 1988
50.163
+2.352
4.92%
jan 1, 1989
53.031
+2.868
5.72%
jan 1, 1990
69.63
+16.599
31.3%
jan 1, 1991
75.218
+5.588
8.02%
jan 1, 1992
63.967
-11.251
-14.96%
jan 1, 1993
65.954
+1.987
3.11%
jan 1, 1994
51.609
-14.344
-21.75%
jan 1, 1995
50.922
-0.688
-1.33%
jan 1, 1996
49.465
-1.456
-2.86%
jan 1, 1997
62.966
+13.501
27.29%
jan 1, 1998
63.781
+0.815
1.29%
jan 1, 1999
56.759
-7.022
-11.01%
jan 1, 2000
51.811
-4.948
-8.72%
jan 1, 2001
50.815
-0.995
-1.92%
jan 1, 2002
52.043
+1.228
2.42%
jan 1, 2003
55.215
+3.172
6.09%
jan 1, 2004
54.913
-0.302
-0.55%
jan 1, 2005
55.543
+0.63
1.15%
jan 1, 2006
55.215
-0.328
-0.59%
jan 1, 2007
55.612
+0.396
0.72%
jan 1, 2008
71.437
+15.825
28.46%
jan 1, 2009
66.474
-4.963
-6.95%
jan 1, 2010
61.379
-5.095
-7.67%
jan 1, 2011
62.297
+0.918
1.5%
jan 1, 2012
62.514
+0.217
0.35%
jan 1, 2013
57.833
-4.681
-7.49%
jan 1, 2014
52.595
-5.239
-9.06%
jan 1, 2015
48.18
-4.415
-8.39%
jan 1, 2016
46.761
-1.419
-2.94%
Ranking of countries by current statistics by years


Comments: