29
/
en
AIzaSyAYiBZKx7MnpbEhh9jyipgxe19OcubqV5w
April 1, 2024
224420
Philippines
PHL
true
2
1
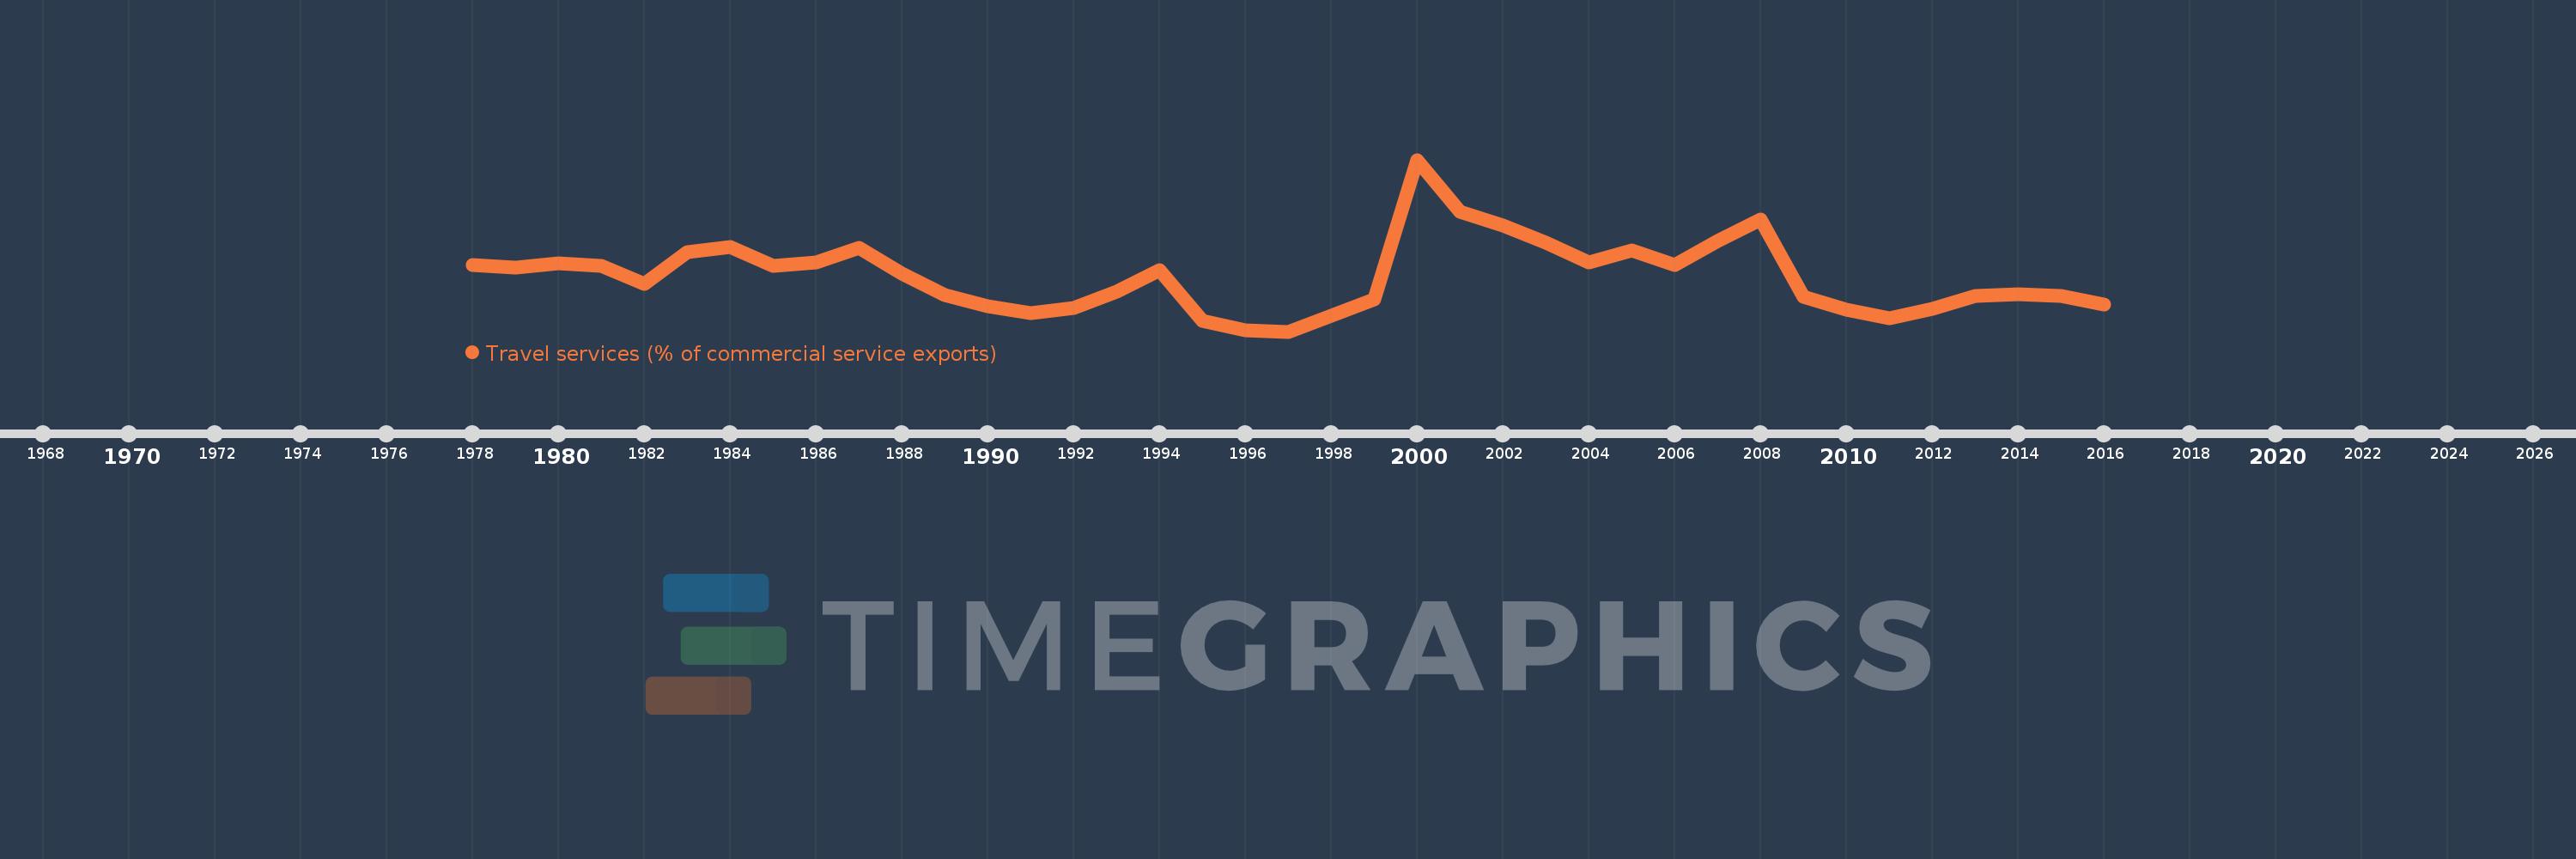
Travel services (% of commercial service exports)
2016,2015,2014,2013,2012,2011,2010,2009,2008,2007,2006,2005,2004,2003,2002,2001,2000,1999,1998,1997,1996,1995,1994,1993,1992,1991,1990,1989,1988,1987,1986,1985,1984,1983,1982,1981,1980,1979,1978
This statistics in other country:
AfghanistanAlbaniaAlgeriaAngolaAntigua and BarbudaArab WorldArgentinaArmeniaArubaAustraliaAustriaAzerbaijanBahamas, TheBahrainBangladeshBarbadosBelarusBelgiumBelizeBeninBermudaBhutanBoliviaBosnia and HerzegovinaBotswanaBrazilBrunei DarussalamBulgariaBurkina FasoBurundiCabo VerdeCambodiaCameroonCanadaCaribbean small statesCentral African RepublicCentral Europe and the BalticsChadChileChinaColombiaComorosCongo, Dem. Rep.Congo, Rep.Costa RicaCote d'IvoireCroatiaCuracaoCyprusCzech RepublicDenmarkDjiboutiDominicaDominican RepublicEarly-demographic dividendEast Asia & PacificEast Asia & Pacific (excluding high income)East Asia & Pacific (IDA & IBRD countries)EcuadorEgypt, Arab Rep.El SalvadorEritreaEstoniaEthiopiaEuro areaEurope & Central AsiaEurope & Central Asia (excluding high income)Europe & Central Asia (IDA & IBRD countries)European UnionFaroe IslandsFijiFinlandFragile and conflict affected situationsFranceFrench PolynesiaGabonGambia, TheGeorgiaGermanyGhanaGreeceGrenadaGuatemalaGuineaGuinea-BissauGuyanaHaitiHeavily indebted poor countries (HIPC)High incomeHondurasHong Kong SAR, ChinaHungaryIBRD onlyIcelandIDA & IBRD totalIDA onlyIDA totalIndiaIndonesiaIran, Islamic Rep.IraqIrelandIsraelItalyJamaicaJapanJordanKazakhstanKenyaKiribatiKorea, Rep.KosovoKuwaitKyrgyz RepublicLao PDRLate-demographic dividendLatin America & Caribbean Latin America & Caribbean (excluding high income)Latin America & the Caribbean (IDA & IBRD countries)LatviaLeast developed countries: UN classificationLebanonLesothoLiberiaLibyaLithuaniaLow & middle incomeLow incomeLower middle incomeLuxembourgMacao SAR, ChinaMacedonia, FYRMadagascarMalawiMalaysiaMaldivesMaliMaltaMarshall IslandsMauritaniaMauritiusMexicoMicronesia, Fed. Sts.Middle East & North Africa (excluding high income)Middle East & North Africa (IDA & IBRD countries)Middle incomeMoldovaMongoliaMontenegroMoroccoMozambiqueMyanmarNamibiaNepalNetherlandsNew CaledoniaNew ZealandNicaraguaNigerNigeriaNorth AmericaNorwayOECD membersOmanOther small statesPacific island small statesPakistanPalauPanamaPapua New GuineaParaguayPeruPhilippinesPolandPortugalPost-demographic dividendPre-demographic dividendQatarRomaniaRussian FederationRwandaSamoaSao Tome and PrincipeSaudi ArabiaSenegalSerbiaSeychellesSierra LeoneSingaporeSint Maarten (Dutch part)Slovak RepublicSloveniaSmall statesSolomon IslandsSouth AfricaSouth AsiaSouth Asia (IDA & IBRD)South SudanSpainSri LankaSt. Kitts and NevisSt. LuciaSt. Vincent and the GrenadinesSub-Saharan Africa Sub-Saharan Africa (excluding high income)Sub-Saharan Africa (IDA & IBRD countries)SudanSurinameSwazilandSwedenSwitzerlandSyrian Arab RepublicTajikistanTanzaniaThailandTimor-LesteTogoTongaTrinidad and TobagoTunisiaTurkeyTuvaluUgandaUkraineUnited KingdomUnited StatesUpper middle incomeUruguayVanuatuVenezuela, RBWest Bank and GazaWorldYemen, Rep.ZambiaZimbabwe Timeline:
This timeline shows a graph from 1978 to 2016 of Philippines. No data until 1977. Number of actual observations by date: 39.
Source name:
World Development Indicators
Source organization:
International Monetary Fund, Balance of Payments Statistics Yearbook and data files.
Categories, topics:
Private Sector, Trade
Last updated:
apr 23, 2017
Indicators value changes by year
Minimum:
11.958
jan 1, 1997
Maximum:
49.807
jan 1, 2000
At the date of observation
Value
Absolute change
Change from previous value
jan 1, 1978
26.703
+26.703
0.0%
jan 1, 1979
25.99
-0.713
-2.67%
jan 1, 1980
26.954
+0.963
3.71%
jan 1, 1981
26.359
-0.594
-2.21%
jan 1, 1982
22.454
-3.905
-14.81%
jan 1, 1983
29.547
+7.093
31.59%
jan 1, 1984
30.673
+1.126
3.81%
jan 1, 1985
26.426
-4.247
-13.85%
jan 1, 1986
27.175
+0.749
2.83%
jan 1, 1987
30.376
+3.201
11.78%
jan 1, 1988
24.677
-5.699
-18.76%
jan 1, 1989
20.01
-4.667
-18.91%
jan 1, 1990
17.487
-2.523
-12.61%
jan 1, 1991
16.086
-1.401
-8.01%
jan 1, 1992
17.205
+1.119
6.96%
jan 1, 1993
20.679
+3.474
20.19%
jan 1, 1994
25.514
+4.835
23.38%
jan 1, 1995
14.417
-11.097
-43.49%
jan 1, 1996
12.185
-2.232
-15.48%
jan 1, 1997
11.958
-0.227
-1.87%
jan 1, 1998
15.473
+3.515
29.4%
jan 1, 1999
18.995
+3.523
22.77%
jan 1, 2000
49.807
+30.811
162.21%
jan 1, 2001
38.37
-11.437
-22.96%
jan 1, 2002
35.385
-2.985
-7.78%
jan 1, 2003
31.587
-3.797
-10.73%
jan 1, 2004
27.25
-4.337
-13.73%
jan 1, 2005
29.913
+2.662
9.77%
jan 1, 2006
26.564
-3.348
-11.19%
jan 1, 2007
32.015
+5.451
20.52%
jan 1, 2008
36.743
+4.728
14.77%
jan 1, 2009
19.63
-17.114
-46.58%
jan 1, 2010
16.827
-2.803
-14.28%
jan 1, 2011
14.885
-1.942
-11.54%
jan 1, 2012
16.949
+2.064
13.87%
jan 1, 2013
19.88
+2.931
17.29%
jan 1, 2014
20.109
+0.229
1.15%
jan 1, 2015
19.739
-0.37
-1.84%
jan 1, 2016
18.005
-1.734
-8.78%
Ranking of countries by current statistics by years


Comments: