29
/
en
AIzaSyAYiBZKx7MnpbEhh9jyipgxe19OcubqV5w
April 1, 2024
232906
Samoa
WSM
true
2
1
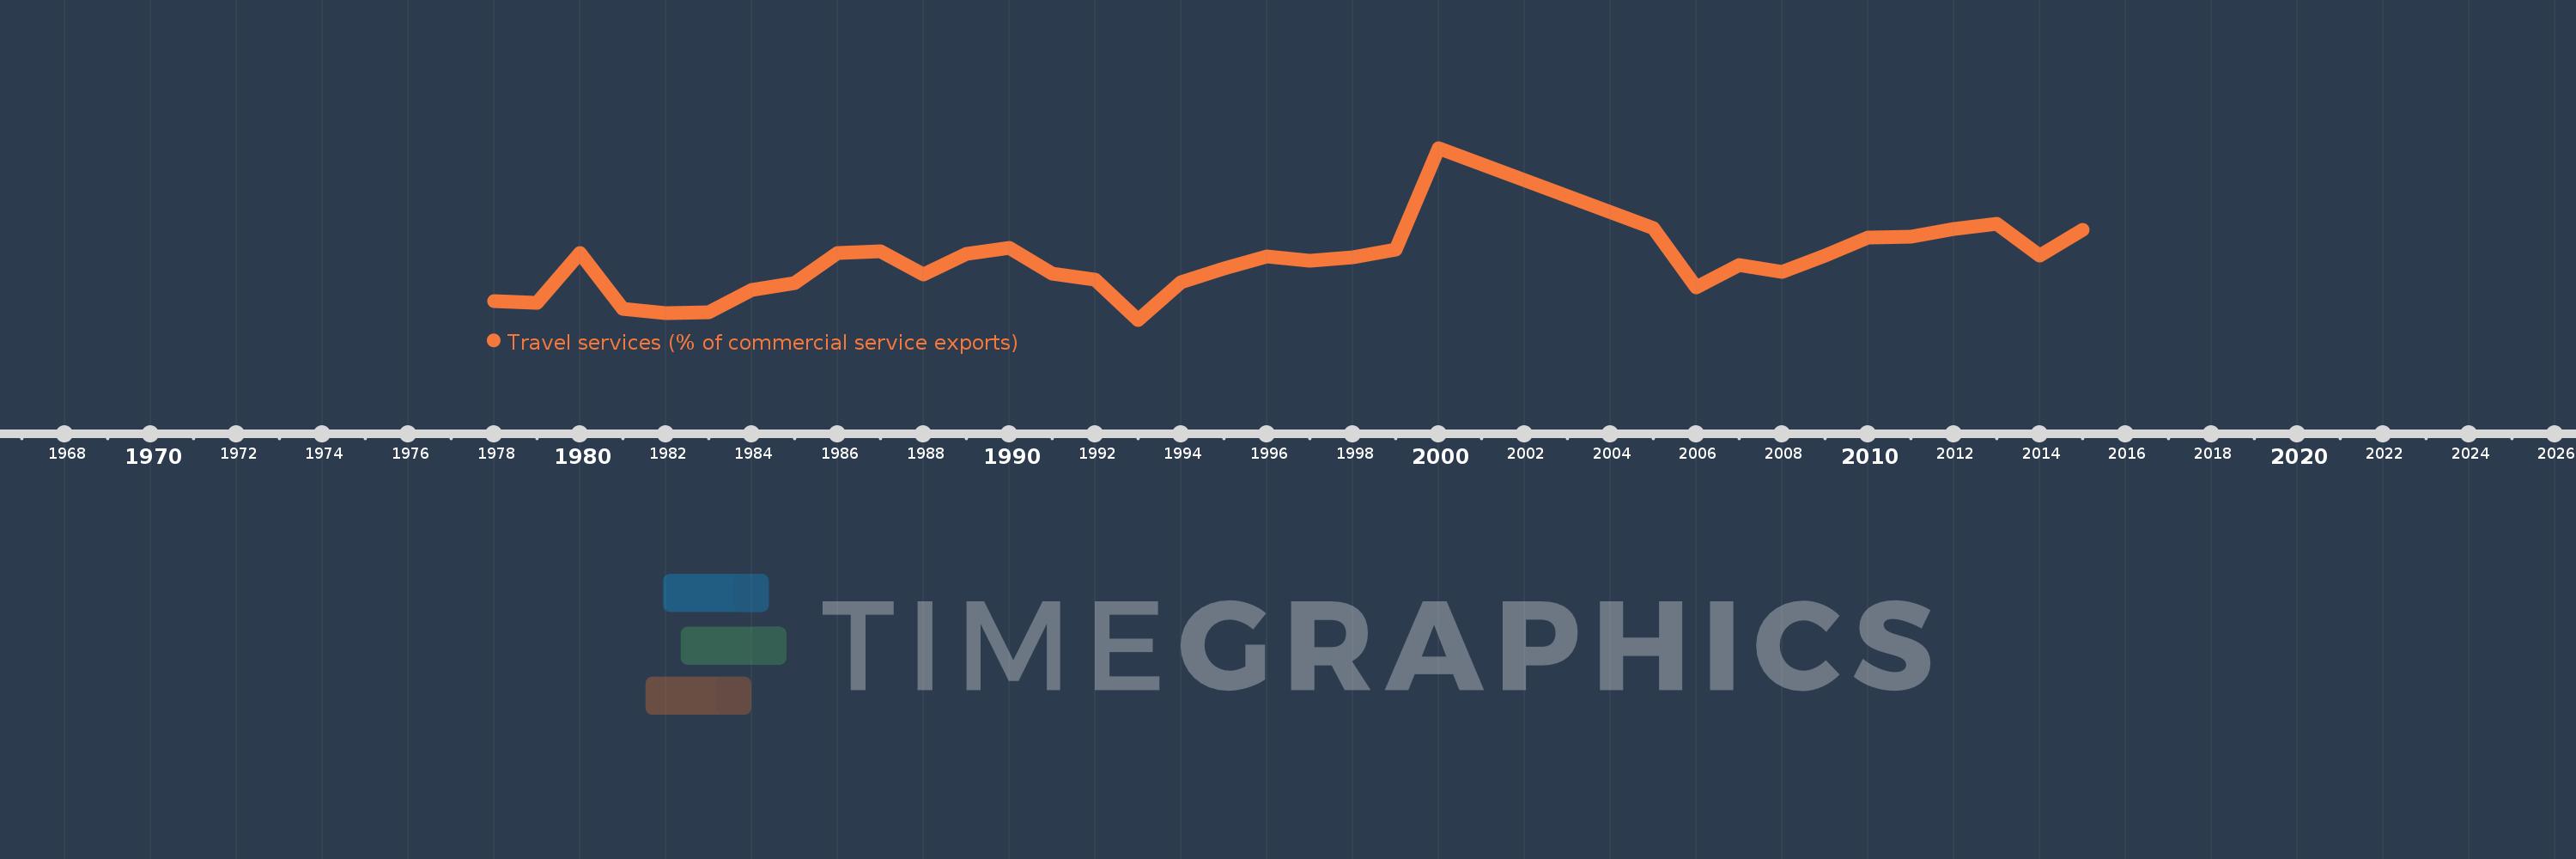
Travel services (% of commercial service exports)
2015,2014,2013,2012,2011,2010,2009,2008,2007,2006,2005,2000,1999,1998,1997,1996,1995,1994,1993,1992,1991,1990,1989,1988,1987,1986,1985,1984,1983,1982,1981,1980,1979,1978
This statistics in other country:
AfghanistanAlbaniaAlgeriaAngolaAntigua and BarbudaArab WorldArgentinaArmeniaArubaAustraliaAustriaAzerbaijanBahamas, TheBahrainBangladeshBarbadosBelarusBelgiumBelizeBeninBermudaBhutanBoliviaBosnia and HerzegovinaBotswanaBrazilBrunei DarussalamBulgariaBurkina FasoBurundiCabo VerdeCambodiaCameroonCanadaCaribbean small statesCentral African RepublicCentral Europe and the BalticsChadChileChinaColombiaComorosCongo, Dem. Rep.Congo, Rep.Costa RicaCote d'IvoireCroatiaCuracaoCyprusCzech RepublicDenmarkDjiboutiDominicaDominican RepublicEarly-demographic dividendEast Asia & PacificEast Asia & Pacific (excluding high income)East Asia & Pacific (IDA & IBRD countries)EcuadorEgypt, Arab Rep.El SalvadorEritreaEstoniaEthiopiaEuro areaEurope & Central AsiaEurope & Central Asia (excluding high income)Europe & Central Asia (IDA & IBRD countries)European UnionFaroe IslandsFijiFinlandFragile and conflict affected situationsFranceFrench PolynesiaGabonGambia, TheGeorgiaGermanyGhanaGreeceGrenadaGuatemalaGuineaGuinea-BissauGuyanaHaitiHeavily indebted poor countries (HIPC)High incomeHondurasHong Kong SAR, ChinaHungaryIBRD onlyIcelandIDA & IBRD totalIDA onlyIDA totalIndiaIndonesiaIran, Islamic Rep.IraqIrelandIsraelItalyJamaicaJapanJordanKazakhstanKenyaKiribatiKorea, Rep.KosovoKuwaitKyrgyz RepublicLao PDRLate-demographic dividendLatin America & Caribbean Latin America & Caribbean (excluding high income)Latin America & the Caribbean (IDA & IBRD countries)LatviaLeast developed countries: UN classificationLebanonLesothoLiberiaLibyaLithuaniaLow & middle incomeLow incomeLower middle incomeLuxembourgMacao SAR, ChinaMacedonia, FYRMadagascarMalawiMalaysiaMaldivesMaliMaltaMarshall IslandsMauritaniaMauritiusMexicoMicronesia, Fed. Sts.Middle East & North Africa (excluding high income)Middle East & North Africa (IDA & IBRD countries)Middle incomeMoldovaMongoliaMontenegroMoroccoMozambiqueMyanmarNamibiaNepalNetherlandsNew CaledoniaNew ZealandNicaraguaNigerNigeriaNorth AmericaNorwayOECD membersOmanOther small statesPacific island small statesPakistanPalauPanamaPapua New GuineaParaguayPeruPhilippinesPolandPortugalPost-demographic dividendPre-demographic dividendQatarRomaniaRussian FederationRwandaSamoaSao Tome and PrincipeSaudi ArabiaSenegalSerbiaSeychellesSierra LeoneSingaporeSint Maarten (Dutch part)Slovak RepublicSloveniaSmall statesSolomon IslandsSouth AfricaSouth AsiaSouth Asia (IDA & IBRD)South SudanSpainSri LankaSt. Kitts and NevisSt. LuciaSt. Vincent and the GrenadinesSub-Saharan Africa Sub-Saharan Africa (excluding high income)Sub-Saharan Africa (IDA & IBRD countries)SudanSurinameSwazilandSwedenSwitzerlandSyrian Arab RepublicTajikistanTanzaniaThailandTimor-LesteTogoTongaTrinidad and TobagoTunisiaTurkeyTuvaluUgandaUkraineUnited KingdomUnited StatesUpper middle incomeUruguayVanuatuVenezuela, RBWest Bank and GazaWorldYemen, Rep.ZambiaZimbabwe Timeline:
This timeline shows a graph from 1978 to 2015 of Samoa. No data until 1977. Number of actual observations by date: 34.
Source name:
World Development Indicators
Source organization:
International Monetary Fund, Balance of Payments Statistics Yearbook and data files.
Categories, topics:
Private Sector, Trade
Last updated:
apr 23, 2017
Indicators value changes by year
Minimum:
47.012
jan 1, 1993
Maximum:
97.754
jan 1, 2000
At the date of observation
Value
Absolute change
Change from previous value
jan 1, 1978
52.632
+52.632
0.0%
jan 1, 1979
52.083
-0.548
-1.04%
jan 1, 1980
66.667
+14.583
28.0%
jan 1, 1981
50.36
-16.307
-24.46%
jan 1, 1982
49.02
-1.34
-2.66%
jan 1, 1983
49.143
+0.123
0.25%
jan 1, 1984
55.939
+6.796
13.83%
jan 1, 1985
57.958
+2.02
3.61%
jan 1, 1986
66.788
+8.829
15.23%
jan 1, 1987
67.312
+0.525
0.79%
jan 1, 1988
60.3
-7.012
-10.42%
jan 1, 1989
66.388
+6.088
10.1%
jan 1, 1990
68.279
+1.89
2.85%
jan 1, 1991
60.656
-7.623
-11.16%
jan 1, 1992
58.972
-1.684
-2.78%
jan 1, 1993
47.012
-11.96
-20.28%
jan 1, 1994
58.101
+11.089
23.59%
jan 1, 1995
62.276
+4.175
7.19%
jan 1, 1996
65.697
+3.421
5.49%
jan 1, 1997
64.514
-1.183
-1.8%
jan 1, 1998
65.398
+0.883
1.37%
jan 1, 1999
67.63
+2.232
3.41%
jan 1, 2000
97.754
+30.125
44.54%
jan 1, 2005
73.977
-23.778
-24.32%
jan 1, 2006
56.459
-17.518
-23.68%
jan 1, 2007
63.113
+6.654
11.79%
jan 1, 2008
61.08
-2.034
-3.22%
jan 1, 2009
65.908
+4.828
7.9%
jan 1, 2010
71.268
+5.36
8.13%
jan 1, 2011
71.47
+0.202
0.28%
jan 1, 2012
73.943
+2.473
3.46%
jan 1, 2013
75.341
+1.398
1.89%
jan 1, 2014
65.951
-9.39
-12.46%
jan 1, 2015
73.696
+7.745
11.74%
Ranking of countries by current statistics by years


Comments: