29
/
en
AIzaSyAYiBZKx7MnpbEhh9jyipgxe19OcubqV5w
April 1, 2024
241054
Singapore
SGP
true
2
1
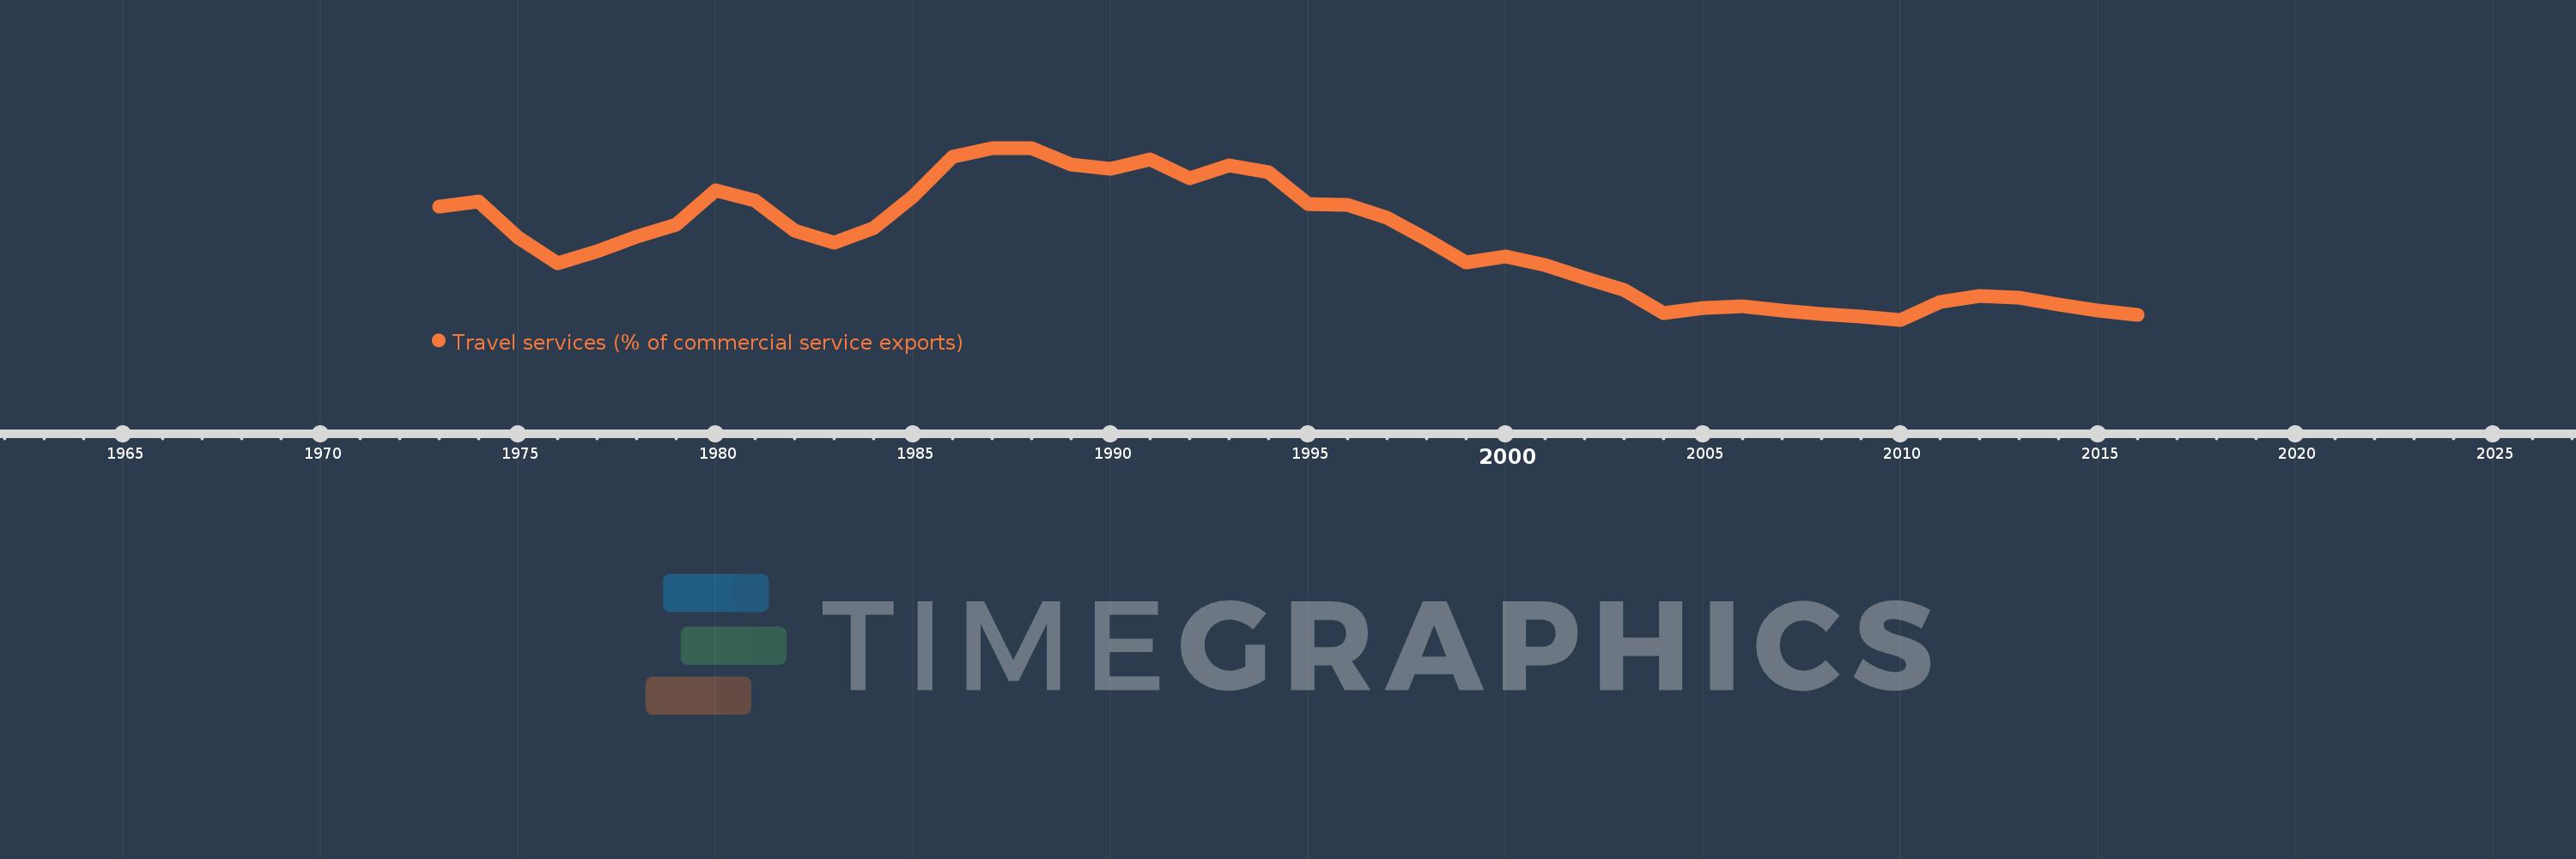
Travel services (% of commercial service exports)
2016,2015,2014,2013,2012,2011,2010,2009,2008,2007,2006,2005,2004,2003,2002,2001,2000,1999,1998,1997,1996,1995,1994,1993,1992,1991,1990,1989,1988,1987,1986,1985,1984,1983,1982,1981,1980,1979,1978,1977,1976,1975,1974,1973
This statistics in other country:
AfghanistanAlbaniaAlgeriaAngolaAntigua and BarbudaArab WorldArgentinaArmeniaArubaAustraliaAustriaAzerbaijanBahamas, TheBahrainBangladeshBarbadosBelarusBelgiumBelizeBeninBermudaBhutanBoliviaBosnia and HerzegovinaBotswanaBrazilBrunei DarussalamBulgariaBurkina FasoBurundiCabo VerdeCambodiaCameroonCanadaCaribbean small statesCentral African RepublicCentral Europe and the BalticsChadChileChinaColombiaComorosCongo, Dem. Rep.Congo, Rep.Costa RicaCote d'IvoireCroatiaCuracaoCyprusCzech RepublicDenmarkDjiboutiDominicaDominican RepublicEarly-demographic dividendEast Asia & PacificEast Asia & Pacific (excluding high income)East Asia & Pacific (IDA & IBRD countries)EcuadorEgypt, Arab Rep.El SalvadorEritreaEstoniaEthiopiaEuro areaEurope & Central AsiaEurope & Central Asia (excluding high income)Europe & Central Asia (IDA & IBRD countries)European UnionFaroe IslandsFijiFinlandFragile and conflict affected situationsFranceFrench PolynesiaGabonGambia, TheGeorgiaGermanyGhanaGreeceGrenadaGuatemalaGuineaGuinea-BissauGuyanaHaitiHeavily indebted poor countries (HIPC)High incomeHondurasHong Kong SAR, ChinaHungaryIBRD onlyIcelandIDA & IBRD totalIDA onlyIDA totalIndiaIndonesiaIran, Islamic Rep.IraqIrelandIsraelItalyJamaicaJapanJordanKazakhstanKenyaKiribatiKorea, Rep.KosovoKuwaitKyrgyz RepublicLao PDRLate-demographic dividendLatin America & Caribbean Latin America & Caribbean (excluding high income)Latin America & the Caribbean (IDA & IBRD countries)LatviaLeast developed countries: UN classificationLebanonLesothoLiberiaLibyaLithuaniaLow & middle incomeLow incomeLower middle incomeLuxembourgMacao SAR, ChinaMacedonia, FYRMadagascarMalawiMalaysiaMaldivesMaliMaltaMarshall IslandsMauritaniaMauritiusMexicoMicronesia, Fed. Sts.Middle East & North Africa (excluding high income)Middle East & North Africa (IDA & IBRD countries)Middle incomeMoldovaMongoliaMontenegroMoroccoMozambiqueMyanmarNamibiaNepalNetherlandsNew CaledoniaNew ZealandNicaraguaNigerNigeriaNorth AmericaNorwayOECD membersOmanOther small statesPacific island small statesPakistanPalauPanamaPapua New GuineaParaguayPeruPhilippinesPolandPortugalPost-demographic dividendPre-demographic dividendQatarRomaniaRussian FederationRwandaSamoaSao Tome and PrincipeSaudi ArabiaSenegalSerbiaSeychellesSierra LeoneSingaporeSint Maarten (Dutch part)Slovak RepublicSloveniaSmall statesSolomon IslandsSouth AfricaSouth AsiaSouth Asia (IDA & IBRD)South SudanSpainSri LankaSt. Kitts and NevisSt. LuciaSt. Vincent and the GrenadinesSub-Saharan Africa Sub-Saharan Africa (excluding high income)Sub-Saharan Africa (IDA & IBRD countries)SudanSurinameSwazilandSwedenSwitzerlandSyrian Arab RepublicTajikistanTanzaniaThailandTimor-LesteTogoTongaTrinidad and TobagoTunisiaTurkeyTuvaluUgandaUkraineUnited KingdomUnited StatesUpper middle incomeUruguayVanuatuVenezuela, RBWest Bank and GazaWorldYemen, Rep.ZambiaZimbabwe Timeline:
This timeline shows a graph from 1973 to 2016 of Singapore. No data until 1972. Number of actual observations by date: 44.
Source name:
World Development Indicators
Source organization:
International Monetary Fund, Balance of Payments Statistics Yearbook and data files.
Categories, topics:
Private Sector, Trade
Last updated:
apr 23, 2017
Indicators value changes by year
Minimum:
11.306
jan 1, 2010
Maximum:
38.351
jan 1, 1987
At the date of observation
Value
Absolute change
Change from previous value
jan 1, 1973
29.144
+29.144
0.0%
jan 1, 1974
29.893
+0.749
2.57%
jan 1, 1975
24.205
-5.688
-19.03%
jan 1, 1976
20.169
-4.035
-16.67%
jan 1, 1977
22.04
+1.871
9.28%
jan 1, 1978
24.374
+2.333
10.59%
jan 1, 1979
26.302
+1.928
7.91%
jan 1, 1980
31.634
+5.332
20.27%
jan 1, 1981
30.011
-1.623
-5.13%
jan 1, 1982
25.289
-4.722
-15.73%
jan 1, 1983
23.493
-1.796
-7.1%
jan 1, 1984
25.796
+2.302
9.8%
jan 1, 1985
30.753
+4.958
19.22%
jan 1, 1986
37.014
+6.261
20.36%
jan 1, 1987
38.351
+1.336
3.61%
jan 1, 1988
38.266
-0.084
-0.22%
jan 1, 1989
35.789
-2.477
-6.47%
jan 1, 1990
35.1
-0.688
-1.92%
jan 1, 1991
36.556
+1.456
4.15%
jan 1, 1992
33.619
-2.937
-8.03%
jan 1, 1993
35.583
+1.964
5.84%
jan 1, 1994
34.577
-1.006
-2.83%
jan 1, 1995
29.561
-5.016
-14.51%
jan 1, 1996
29.418
-0.144
-0.49%
jan 1, 1997
27.398
-2.019
-6.86%
jan 1, 1998
24.021
-3.377
-12.33%
jan 1, 1999
20.299
-3.722
-15.49%
jan 1, 2000
21.216
+0.917
4.52%
jan 1, 2001
19.894
-1.322
-6.23%
jan 1, 2002
17.885
-2.01
-10.1%
jan 1, 2003
15.99
-1.894
-10.59%
jan 1, 2004
12.392
-3.599
-22.5%
jan 1, 2005
13.214
+0.822
6.63%
jan 1, 2006
13.427
+0.213
1.62%
jan 1, 2007
12.769
-0.658
-4.9%
jan 1, 2008
12.252
-0.517
-4.05%
jan 1, 2009
11.87
-0.382
-3.12%
jan 1, 2010
11.306
-0.564
-4.76%
jan 1, 2011
14.097
+2.791
24.68%
jan 1, 2012
15.112
+1.015
7.2%
jan 1, 2013
14.745
-0.367
-2.43%
jan 1, 2014
13.725
-1.019
-6.91%
jan 1, 2015
12.718
-1.008
-7.34%
jan 1, 2016
12.017
-0.701
-5.51%
Ranking of countries by current statistics by years


Comments: