29
/
en
AIzaSyAYiBZKx7MnpbEhh9jyipgxe19OcubqV5w
April 1, 2024
278369
Uruguay
URY
true
2
1
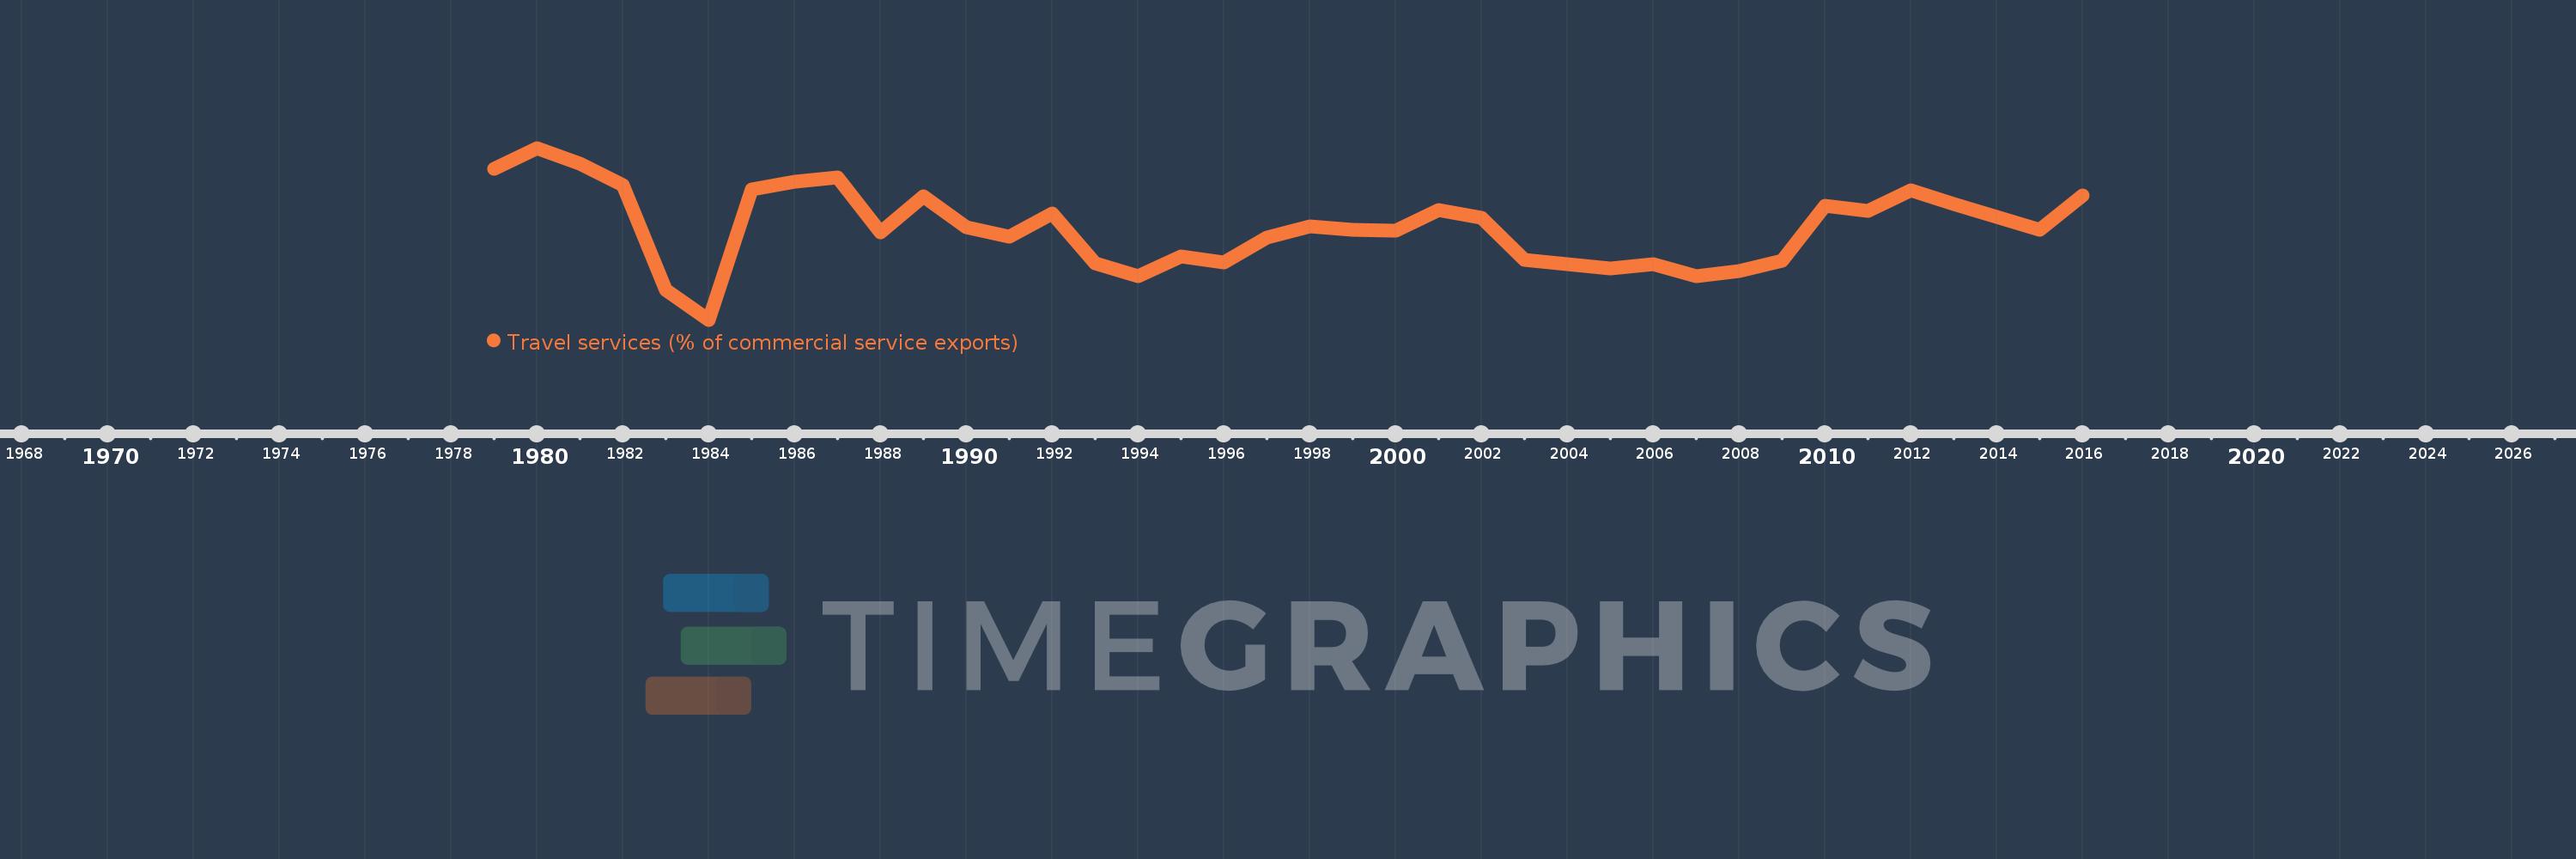
Travel services (% of commercial service exports)
2016,2015,2014,2013,2012,2011,2010,2009,2008,2007,2006,2005,2004,2003,2002,2001,2000,1999,1998,1997,1996,1995,1994,1993,1992,1991,1990,1989,1988,1987,1986,1985,1984,1983,1982,1981,1980,1979
This statistics in other country:
AfghanistanAlbaniaAlgeriaAngolaAntigua and BarbudaArab WorldArgentinaArmeniaArubaAustraliaAustriaAzerbaijanBahamas, TheBahrainBangladeshBarbadosBelarusBelgiumBelizeBeninBermudaBhutanBoliviaBosnia and HerzegovinaBotswanaBrazilBrunei DarussalamBulgariaBurkina FasoBurundiCabo VerdeCambodiaCameroonCanadaCaribbean small statesCentral African RepublicCentral Europe and the BalticsChadChileChinaColombiaComorosCongo, Dem. Rep.Congo, Rep.Costa RicaCote d'IvoireCroatiaCuracaoCyprusCzech RepublicDenmarkDjiboutiDominicaDominican RepublicEarly-demographic dividendEast Asia & PacificEast Asia & Pacific (excluding high income)East Asia & Pacific (IDA & IBRD countries)EcuadorEgypt, Arab Rep.El SalvadorEritreaEstoniaEthiopiaEuro areaEurope & Central AsiaEurope & Central Asia (excluding high income)Europe & Central Asia (IDA & IBRD countries)European UnionFaroe IslandsFijiFinlandFragile and conflict affected situationsFranceFrench PolynesiaGabonGambia, TheGeorgiaGermanyGhanaGreeceGrenadaGuatemalaGuineaGuinea-BissauGuyanaHaitiHeavily indebted poor countries (HIPC)High incomeHondurasHong Kong SAR, ChinaHungaryIBRD onlyIcelandIDA & IBRD totalIDA onlyIDA totalIndiaIndonesiaIran, Islamic Rep.IraqIrelandIsraelItalyJamaicaJapanJordanKazakhstanKenyaKiribatiKorea, Rep.KosovoKuwaitKyrgyz RepublicLao PDRLate-demographic dividendLatin America & Caribbean Latin America & Caribbean (excluding high income)Latin America & the Caribbean (IDA & IBRD countries)LatviaLeast developed countries: UN classificationLebanonLesothoLiberiaLibyaLithuaniaLow & middle incomeLow incomeLower middle incomeLuxembourgMacao SAR, ChinaMacedonia, FYRMadagascarMalawiMalaysiaMaldivesMaliMaltaMarshall IslandsMauritaniaMauritiusMexicoMicronesia, Fed. Sts.Middle East & North Africa (excluding high income)Middle East & North Africa (IDA & IBRD countries)Middle incomeMoldovaMongoliaMontenegroMoroccoMozambiqueMyanmarNamibiaNepalNetherlandsNew CaledoniaNew ZealandNicaraguaNigerNigeriaNorth AmericaNorwayOECD membersOmanOther small statesPacific island small statesPakistanPalauPanamaPapua New GuineaParaguayPeruPhilippinesPolandPortugalPost-demographic dividendPre-demographic dividendQatarRomaniaRussian FederationRwandaSamoaSao Tome and PrincipeSaudi ArabiaSenegalSerbiaSeychellesSierra LeoneSingaporeSint Maarten (Dutch part)Slovak RepublicSloveniaSmall statesSolomon IslandsSouth AfricaSouth AsiaSouth Asia (IDA & IBRD)South SudanSpainSri LankaSt. Kitts and NevisSt. LuciaSt. Vincent and the GrenadinesSub-Saharan Africa Sub-Saharan Africa (excluding high income)Sub-Saharan Africa (IDA & IBRD countries)SudanSurinameSwazilandSwedenSwitzerlandSyrian Arab RepublicTajikistanTanzaniaThailandTimor-LesteTogoTongaTrinidad and TobagoTunisiaTurkeyTuvaluUgandaUkraineUnited KingdomUnited StatesUpper middle incomeUruguayVanuatuVenezuela, RBWest Bank and GazaWorldYemen, Rep.ZambiaZimbabwe Timeline:
This timeline shows a graph from 1979 to 2016 of Uruguay. No data until 1978. Number of actual observations by date: 38.
Source name:
World Development Indicators
Source organization:
International Monetary Fund, Balance of Payments Statistics Yearbook and data files.
Categories, topics:
Private Sector, Trade
Last updated:
apr 23, 2017
Indicators value changes by year
Maximum:
69.446
jan 1, 1980
At the date of observation
Value
Absolute change
Change from previous value
jan 1, 1979
65.364
+65.364
0.0%
jan 1, 1980
69.446
+4.081
6.24%
jan 1, 1981
66.37
-3.076
-4.43%
jan 1, 1982
62.021
-4.349
-6.55%
jan 1, 1983
41.149
-20.872
-33.65%
jan 1, 1984
35.19
-5.959
-14.48%
jan 1, 1985
61.118
+25.927
73.68%
jan 1, 1986
62.636
+1.519
2.49%
jan 1, 1987
63.513
+0.877
1.4%
jan 1, 1988
52.648
-10.866
-17.11%
jan 1, 1989
59.881
+7.234
13.74%
jan 1, 1990
53.562
-6.32
-10.55%
jan 1, 1991
51.795
-1.767
-3.3%
jan 1, 1992
56.344
+4.549
8.78%
jan 1, 1993
46.396
-9.949
-17.66%
jan 1, 1994
43.81
-2.586
-5.57%
jan 1, 1995
47.738
+3.928
8.97%
jan 1, 1996
46.666
-1.072
-2.25%
jan 1, 1997
51.631
+4.966
10.64%
jan 1, 1998
53.729
+2.098
4.06%
jan 1, 1999
53.107
-0.623
-1.16%
jan 1, 2000
52.872
-0.235
-0.44%
jan 1, 2001
57.088
+4.216
7.97%
jan 1, 2002
55.535
-1.553
-2.72%
jan 1, 2003
47.118
-8.417
-15.16%
jan 1, 2004
46.222
-0.896
-1.9%
jan 1, 2005
45.495
-0.727
-1.57%
jan 1, 2006
46.252
+0.757
1.66%
jan 1, 2007
43.928
-2.324
-5.02%
jan 1, 2008
44.842
+0.914
2.08%
jan 1, 2009
46.919
+2.077
4.63%
jan 1, 2010
57.844
+10.925
23.28%
jan 1, 2011
56.86
-0.984
-1.7%
jan 1, 2012
61.072
+4.212
7.41%
jan 1, 2013
58.215
-2.857
-4.68%
jan 1, 2014
55.74
-2.475
-4.25%
jan 1, 2015
53.077
-2.663
-4.78%
jan 1, 2016
59.956
+6.879
12.96%
Ranking of countries by current statistics by years


Comments: