29
/
en
AIzaSyAYiBZKx7MnpbEhh9jyipgxe19OcubqV5w
April 1, 2024
263103
Thailand
THA
true
2
1
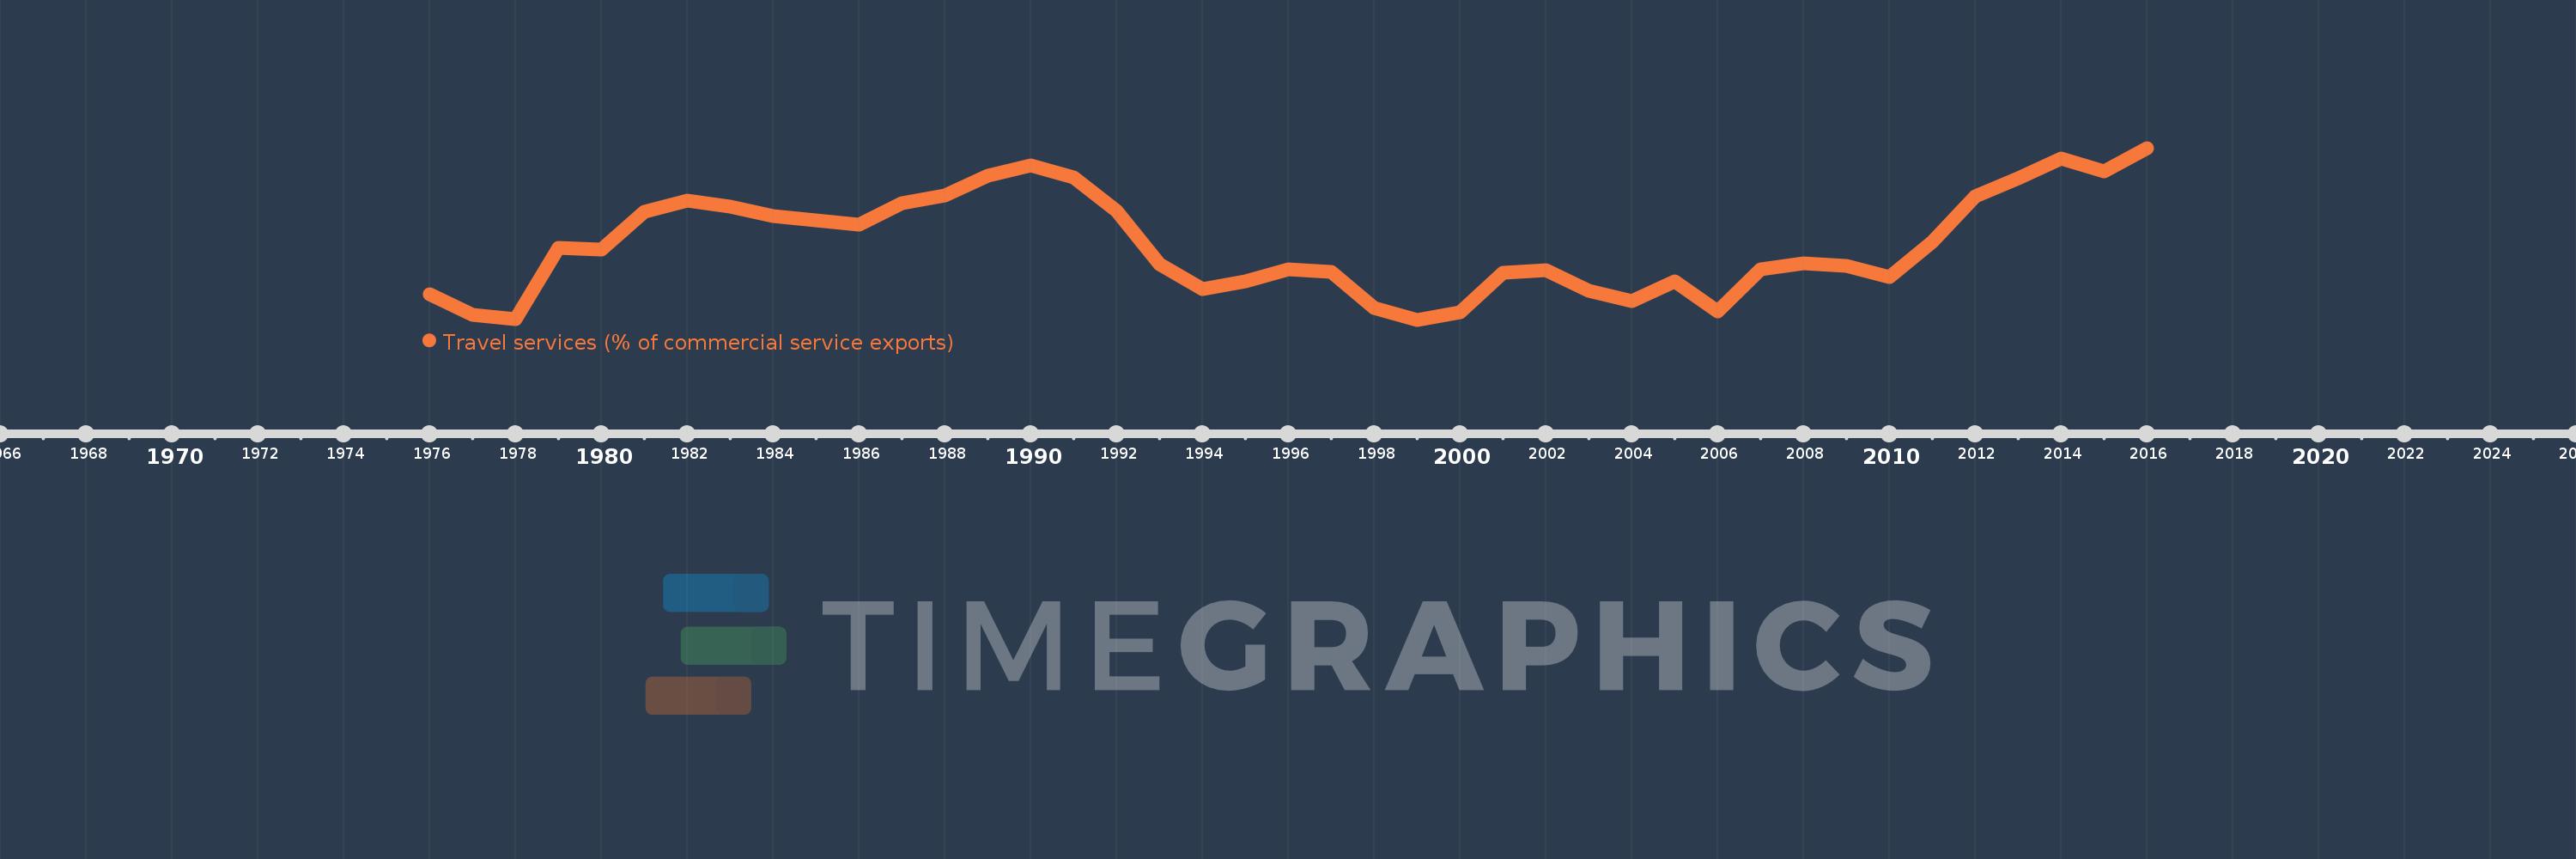
Travel services (% of commercial service exports)
2016,2015,2014,2013,2012,2011,2010,2009,2008,2007,2006,2005,2004,2003,2002,2001,2000,1999,1998,1997,1996,1995,1994,1993,1992,1991,1990,1989,1988,1987,1986,1985,1984,1983,1982,1981,1980,1979,1978,1977,1976
This statistics in other country:
AfghanistanAlbaniaAlgeriaAngolaAntigua and BarbudaArab WorldArgentinaArmeniaArubaAustraliaAustriaAzerbaijanBahamas, TheBahrainBangladeshBarbadosBelarusBelgiumBelizeBeninBermudaBhutanBoliviaBosnia and HerzegovinaBotswanaBrazilBrunei DarussalamBulgariaBurkina FasoBurundiCabo VerdeCambodiaCameroonCanadaCaribbean small statesCentral African RepublicCentral Europe and the BalticsChadChileChinaColombiaComorosCongo, Dem. Rep.Congo, Rep.Costa RicaCote d'IvoireCroatiaCuracaoCyprusCzech RepublicDenmarkDjiboutiDominicaDominican RepublicEarly-demographic dividendEast Asia & PacificEast Asia & Pacific (excluding high income)East Asia & Pacific (IDA & IBRD countries)EcuadorEgypt, Arab Rep.El SalvadorEritreaEstoniaEthiopiaEuro areaEurope & Central AsiaEurope & Central Asia (excluding high income)Europe & Central Asia (IDA & IBRD countries)European UnionFaroe IslandsFijiFinlandFragile and conflict affected situationsFranceFrench PolynesiaGabonGambia, TheGeorgiaGermanyGhanaGreeceGrenadaGuatemalaGuineaGuinea-BissauGuyanaHaitiHeavily indebted poor countries (HIPC)High incomeHondurasHong Kong SAR, ChinaHungaryIBRD onlyIcelandIDA & IBRD totalIDA onlyIDA totalIndiaIndonesiaIran, Islamic Rep.IraqIrelandIsraelItalyJamaicaJapanJordanKazakhstanKenyaKiribatiKorea, Rep.KosovoKuwaitKyrgyz RepublicLao PDRLate-demographic dividendLatin America & Caribbean Latin America & Caribbean (excluding high income)Latin America & the Caribbean (IDA & IBRD countries)LatviaLeast developed countries: UN classificationLebanonLesothoLiberiaLibyaLithuaniaLow & middle incomeLow incomeLower middle incomeLuxembourgMacao SAR, ChinaMacedonia, FYRMadagascarMalawiMalaysiaMaldivesMaliMaltaMarshall IslandsMauritaniaMauritiusMexicoMicronesia, Fed. Sts.Middle East & North Africa (excluding high income)Middle East & North Africa (IDA & IBRD countries)Middle incomeMoldovaMongoliaMontenegroMoroccoMozambiqueMyanmarNamibiaNepalNetherlandsNew CaledoniaNew ZealandNicaraguaNigerNigeriaNorth AmericaNorwayOECD membersOmanOther small statesPacific island small statesPakistanPalauPanamaPapua New GuineaParaguayPeruPhilippinesPolandPortugalPost-demographic dividendPre-demographic dividendQatarRomaniaRussian FederationRwandaSamoaSao Tome and PrincipeSaudi ArabiaSenegalSerbiaSeychellesSierra LeoneSingaporeSint Maarten (Dutch part)Slovak RepublicSloveniaSmall statesSolomon IslandsSouth AfricaSouth AsiaSouth Asia (IDA & IBRD)South SudanSpainSri LankaSt. Kitts and NevisSt. LuciaSt. Vincent and the GrenadinesSub-Saharan Africa Sub-Saharan Africa (excluding high income)Sub-Saharan Africa (IDA & IBRD countries)SudanSurinameSwazilandSwedenSwitzerlandSyrian Arab RepublicTajikistanTanzaniaThailandTimor-LesteTogoTongaTrinidad and TobagoTunisiaTurkeyTuvaluUgandaUkraineUnited KingdomUnited StatesUpper middle incomeUruguayVanuatuVenezuela, RBWest Bank and GazaWorldYemen, Rep.ZambiaZimbabwe Timeline:
This timeline shows a graph from 1976 to 2016 of Thailand. No data until 1975. Number of actual observations by date: 41.
Source name:
World Development Indicators
Source organization:
International Monetary Fund, Balance of Payments Statistics Yearbook and data files.
Categories, topics:
Private Sector, Trade
Last updated:
apr 23, 2017
Indicators value changes by year
Maximum:
73.169
jan 1, 2016
At the date of observation
Value
Absolute change
Change from previous value
jan 1, 1976
51.106
+51.106
0.0%
jan 1, 1977
48.02
-3.086
-6.04%
jan 1, 1978
47.285
-0.735
-1.53%
jan 1, 1979
58.095
+10.81
22.86%
jan 1, 1980
57.846
-0.249
-0.43%
jan 1, 1981
63.504
+5.658
9.78%
jan 1, 1982
65.259
+1.756
2.77%
jan 1, 1983
64.353
-0.906
-1.39%
jan 1, 1984
62.851
-1.502
-2.33%
jan 1, 1985
62.207
-0.644
-1.03%
jan 1, 1986
61.611
-0.596
-0.96%
jan 1, 1987
64.841
+3.23
5.24%
jan 1, 1988
66.032
+1.191
1.84%
jan 1, 1989
69.018
+2.985
4.52%
jan 1, 1990
70.59
+1.573
2.28%
jan 1, 1991
68.736
-1.854
-2.63%
jan 1, 1992
63.615
-5.122
-7.45%
jan 1, 1993
55.58
-8.034
-12.63%
jan 1, 1994
51.833
-3.748
-6.74%
jan 1, 1995
53.067
+1.234
2.38%
jan 1, 1996
54.841
+1.774
3.34%
jan 1, 1997
54.41
-0.431
-0.79%
jan 1, 1998
49.046
-5.364
-9.86%
jan 1, 1999
47.22
-1.826
-3.72%
jan 1, 2000
48.327
+1.107
2.34%
jan 1, 2001
54.282
+5.955
12.32%
jan 1, 2002
54.714
+0.432
0.8%
jan 1, 2003
51.627
-3.087
-5.64%
jan 1, 2004
50.057
-1.57
-3.04%
jan 1, 2005
53.048
+2.992
5.98%
jan 1, 2006
48.43
-4.618
-8.71%
jan 1, 2007
54.865
+6.435
13.29%
jan 1, 2008
55.783
+0.918
1.67%
jan 1, 2009
55.409
-0.374
-0.67%
jan 1, 2010
53.626
-1.783
-3.22%
jan 1, 2011
58.958
+5.332
9.94%
jan 1, 2012
65.897
+6.939
11.77%
jan 1, 2013
68.553
+2.656
4.03%
jan 1, 2014
71.558
+3.005
4.38%
jan 1, 2015
69.62
-1.938
-2.71%
jan 1, 2016
73.169
+3.55
5.1%
Ranking of countries by current statistics by years


Comments: