29
/
en
AIzaSyAYiBZKx7MnpbEhh9jyipgxe19OcubqV5w
April 1, 2024
244317
Solomon Islands
SLB
true
2
1
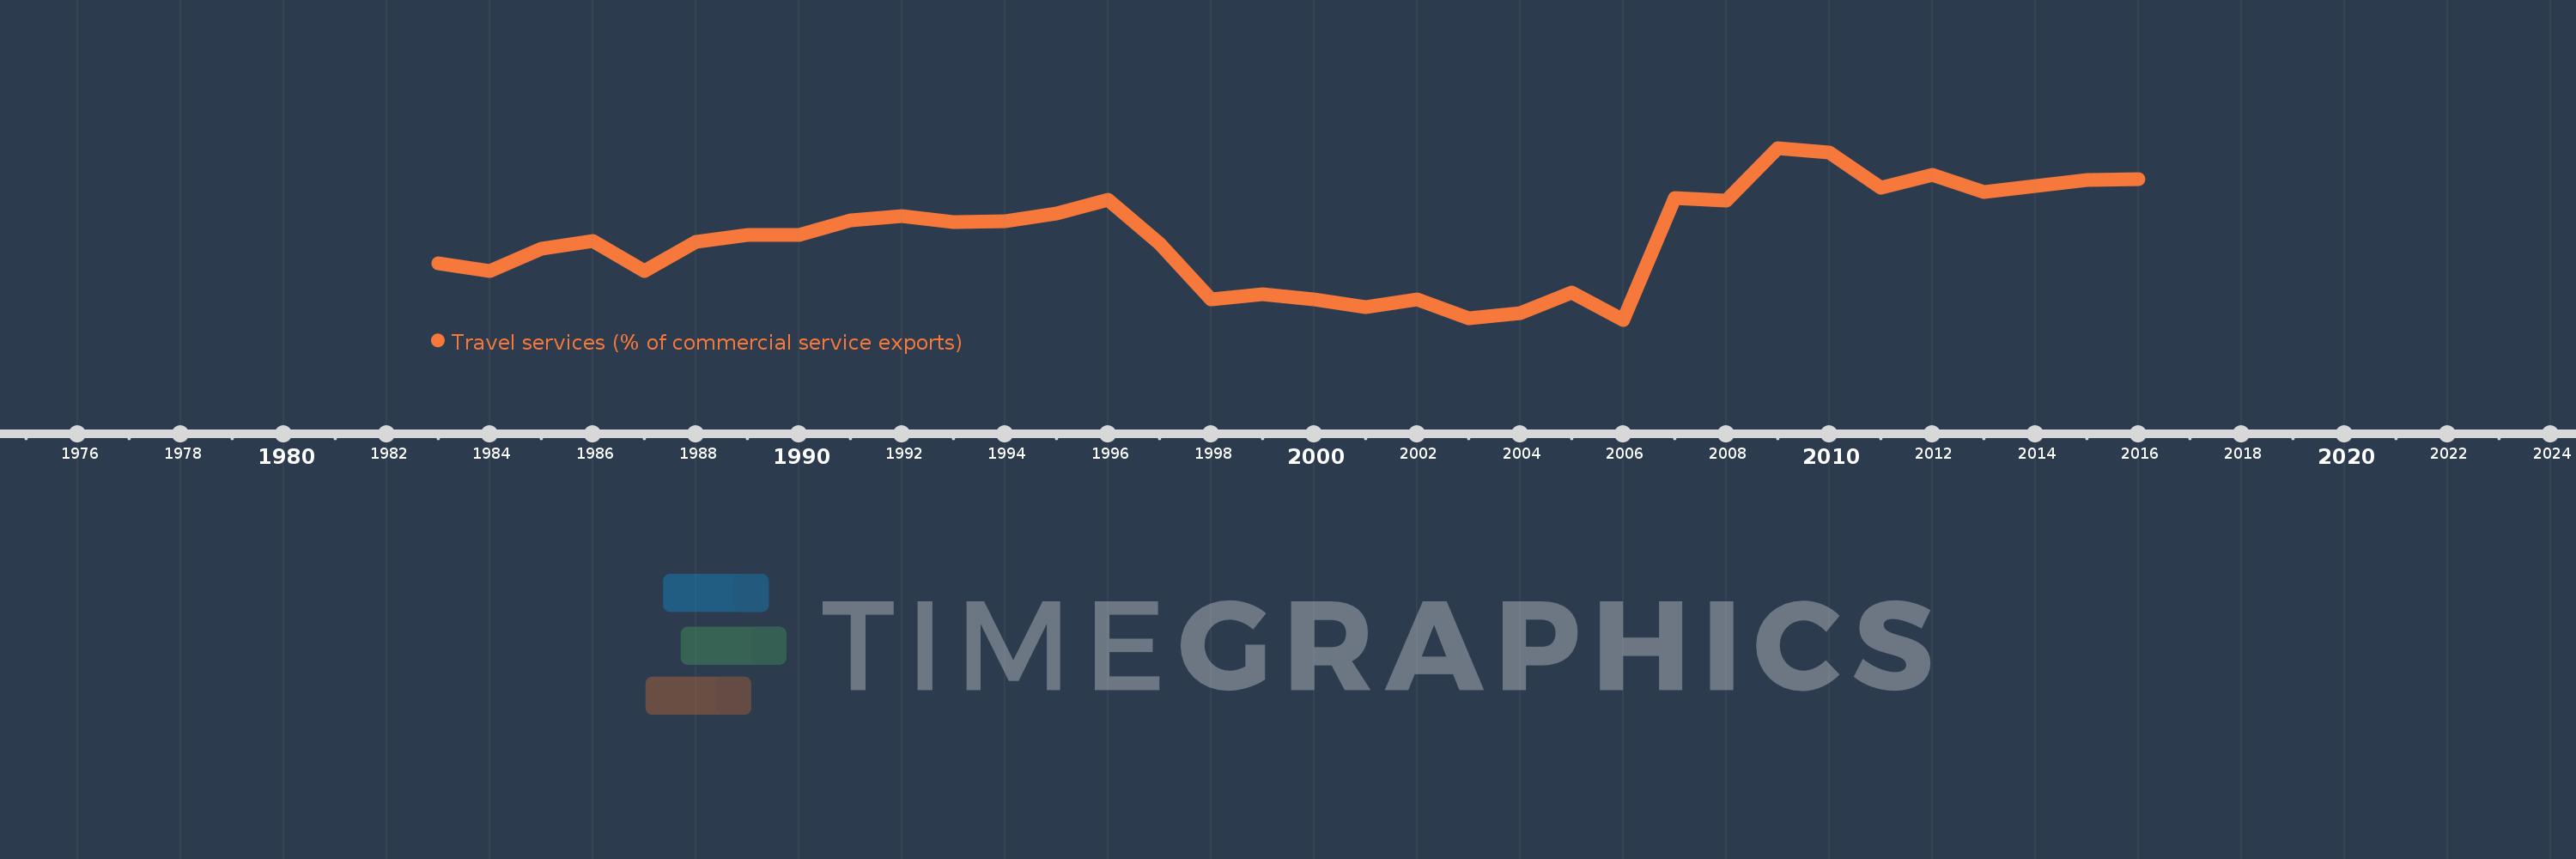
Travel services (% of commercial service exports)
2016,2015,2014,2013,2012,2011,2010,2009,2008,2007,2006,2005,2004,2003,2002,2001,2000,1999,1998,1997,1996,1995,1994,1993,1992,1991,1990,1989,1988,1987,1986,1985,1984,1983
This statistics in other country:
AfghanistanAlbaniaAlgeriaAngolaAntigua and BarbudaArab WorldArgentinaArmeniaArubaAustraliaAustriaAzerbaijanBahamas, TheBahrainBangladeshBarbadosBelarusBelgiumBelizeBeninBermudaBhutanBoliviaBosnia and HerzegovinaBotswanaBrazilBrunei DarussalamBulgariaBurkina FasoBurundiCabo VerdeCambodiaCameroonCanadaCaribbean small statesCentral African RepublicCentral Europe and the BalticsChadChileChinaColombiaComorosCongo, Dem. Rep.Congo, Rep.Costa RicaCote d'IvoireCroatiaCuracaoCyprusCzech RepublicDenmarkDjiboutiDominicaDominican RepublicEarly-demographic dividendEast Asia & PacificEast Asia & Pacific (excluding high income)East Asia & Pacific (IDA & IBRD countries)EcuadorEgypt, Arab Rep.El SalvadorEritreaEstoniaEthiopiaEuro areaEurope & Central AsiaEurope & Central Asia (excluding high income)Europe & Central Asia (IDA & IBRD countries)European UnionFaroe IslandsFijiFinlandFragile and conflict affected situationsFranceFrench PolynesiaGabonGambia, TheGeorgiaGermanyGhanaGreeceGrenadaGuatemalaGuineaGuinea-BissauGuyanaHaitiHeavily indebted poor countries (HIPC)High incomeHondurasHong Kong SAR, ChinaHungaryIBRD onlyIcelandIDA & IBRD totalIDA onlyIDA totalIndiaIndonesiaIran, Islamic Rep.IraqIrelandIsraelItalyJamaicaJapanJordanKazakhstanKenyaKiribatiKorea, Rep.KosovoKuwaitKyrgyz RepublicLao PDRLate-demographic dividendLatin America & Caribbean Latin America & Caribbean (excluding high income)Latin America & the Caribbean (IDA & IBRD countries)LatviaLeast developed countries: UN classificationLebanonLesothoLiberiaLibyaLithuaniaLow & middle incomeLow incomeLower middle incomeLuxembourgMacao SAR, ChinaMacedonia, FYRMadagascarMalawiMalaysiaMaldivesMaliMaltaMarshall IslandsMauritaniaMauritiusMexicoMicronesia, Fed. Sts.Middle East & North Africa (excluding high income)Middle East & North Africa (IDA & IBRD countries)Middle incomeMoldovaMongoliaMontenegroMoroccoMozambiqueMyanmarNamibiaNepalNetherlandsNew CaledoniaNew ZealandNicaraguaNigerNigeriaNorth AmericaNorwayOECD membersOmanOther small statesPacific island small statesPakistanPalauPanamaPapua New GuineaParaguayPeruPhilippinesPolandPortugalPost-demographic dividendPre-demographic dividendQatarRomaniaRussian FederationRwandaSamoaSao Tome and PrincipeSaudi ArabiaSenegalSerbiaSeychellesSierra LeoneSingaporeSint Maarten (Dutch part)Slovak RepublicSloveniaSmall statesSolomon IslandsSouth AfricaSouth AsiaSouth Asia (IDA & IBRD)South SudanSpainSri LankaSt. Kitts and NevisSt. LuciaSt. Vincent and the GrenadinesSub-Saharan Africa Sub-Saharan Africa (excluding high income)Sub-Saharan Africa (IDA & IBRD countries)SudanSurinameSwazilandSwedenSwitzerlandSyrian Arab RepublicTajikistanTanzaniaThailandTimor-LesteTogoTongaTrinidad and TobagoTunisiaTurkeyTuvaluUgandaUkraineUnited KingdomUnited StatesUpper middle incomeUruguayVanuatuVenezuela, RBWest Bank and GazaWorldYemen, Rep.ZambiaZimbabwe Timeline:
This timeline shows a graph from 1983 to 2016 of Solomon Islands. No data until 1982. Number of actual observations by date: 34.
Source name:
World Development Indicators
Source organization:
International Monetary Fund, Balance of Payments Statistics Yearbook and data files.
Categories, topics:
Private Sector, Trade
Last updated:
apr 23, 2017
Indicators value changes by year
Maximum:
61.939
jan 1, 2009
At the date of observation
Value
Absolute change
Change from previous value
jan 1, 1983
23.171
+23.171
0.0%
jan 1, 1984
20.741
-2.43
-10.49%
jan 1, 1985
28.0
+7.259
35.0%
jan 1, 1986
30.833
+2.833
10.12%
jan 1, 1987
20.513
-10.321
-33.47%
jan 1, 1988
30.514
+10.001
48.75%
jan 1, 1989
32.768
+2.255
7.39%
jan 1, 1990
32.747
-0.021
-0.06%
jan 1, 1991
37.526
+4.779
14.59%
jan 1, 1992
39.191
+1.665
4.44%
jan 1, 1993
37.033
-2.159
-5.51%
jan 1, 1994
37.381
+0.348
0.94%
jan 1, 1995
40.058
+2.677
7.16%
jan 1, 1996
44.435
+4.378
10.93%
jan 1, 1997
29.777
-14.658
-32.99%
jan 1, 1998
11.018
-18.759
-63.0%
jan 1, 1999
12.74
+1.722
15.63%
jan 1, 2000
11.197
-1.543
-12.11%
jan 1, 2001
8.589
-2.608
-23.29%
jan 1, 2002
11.202
+2.613
30.42%
jan 1, 2003
4.629
-6.573
-58.68%
jan 1, 2004
6.547
+1.918
41.45%
jan 1, 2005
13.337
+6.789
103.69%
jan 1, 2006
4.24
-9.097
-68.21%
jan 1, 2007
45.192
+40.952
965.89%
jan 1, 2008
44.218
-0.974
-2.16%
jan 1, 2009
61.939
+17.721
40.08%
jan 1, 2010
60.433
-1.506
-2.43%
jan 1, 2011
48.542
-11.891
-19.68%
jan 1, 2012
52.798
+4.256
8.77%
jan 1, 2013
47.234
-5.564
-10.54%
jan 1, 2014
49.181
+1.947
4.12%
jan 1, 2015
51.073
+1.892
3.85%
jan 1, 2016
51.341
+0.268
0.52%
Ranking of countries by current statistics by years


Comments: