29
/
en
AIzaSyAYiBZKx7MnpbEhh9jyipgxe19OcubqV5w
April 1, 2024
246420
South Africa
ZAF
true
2
1
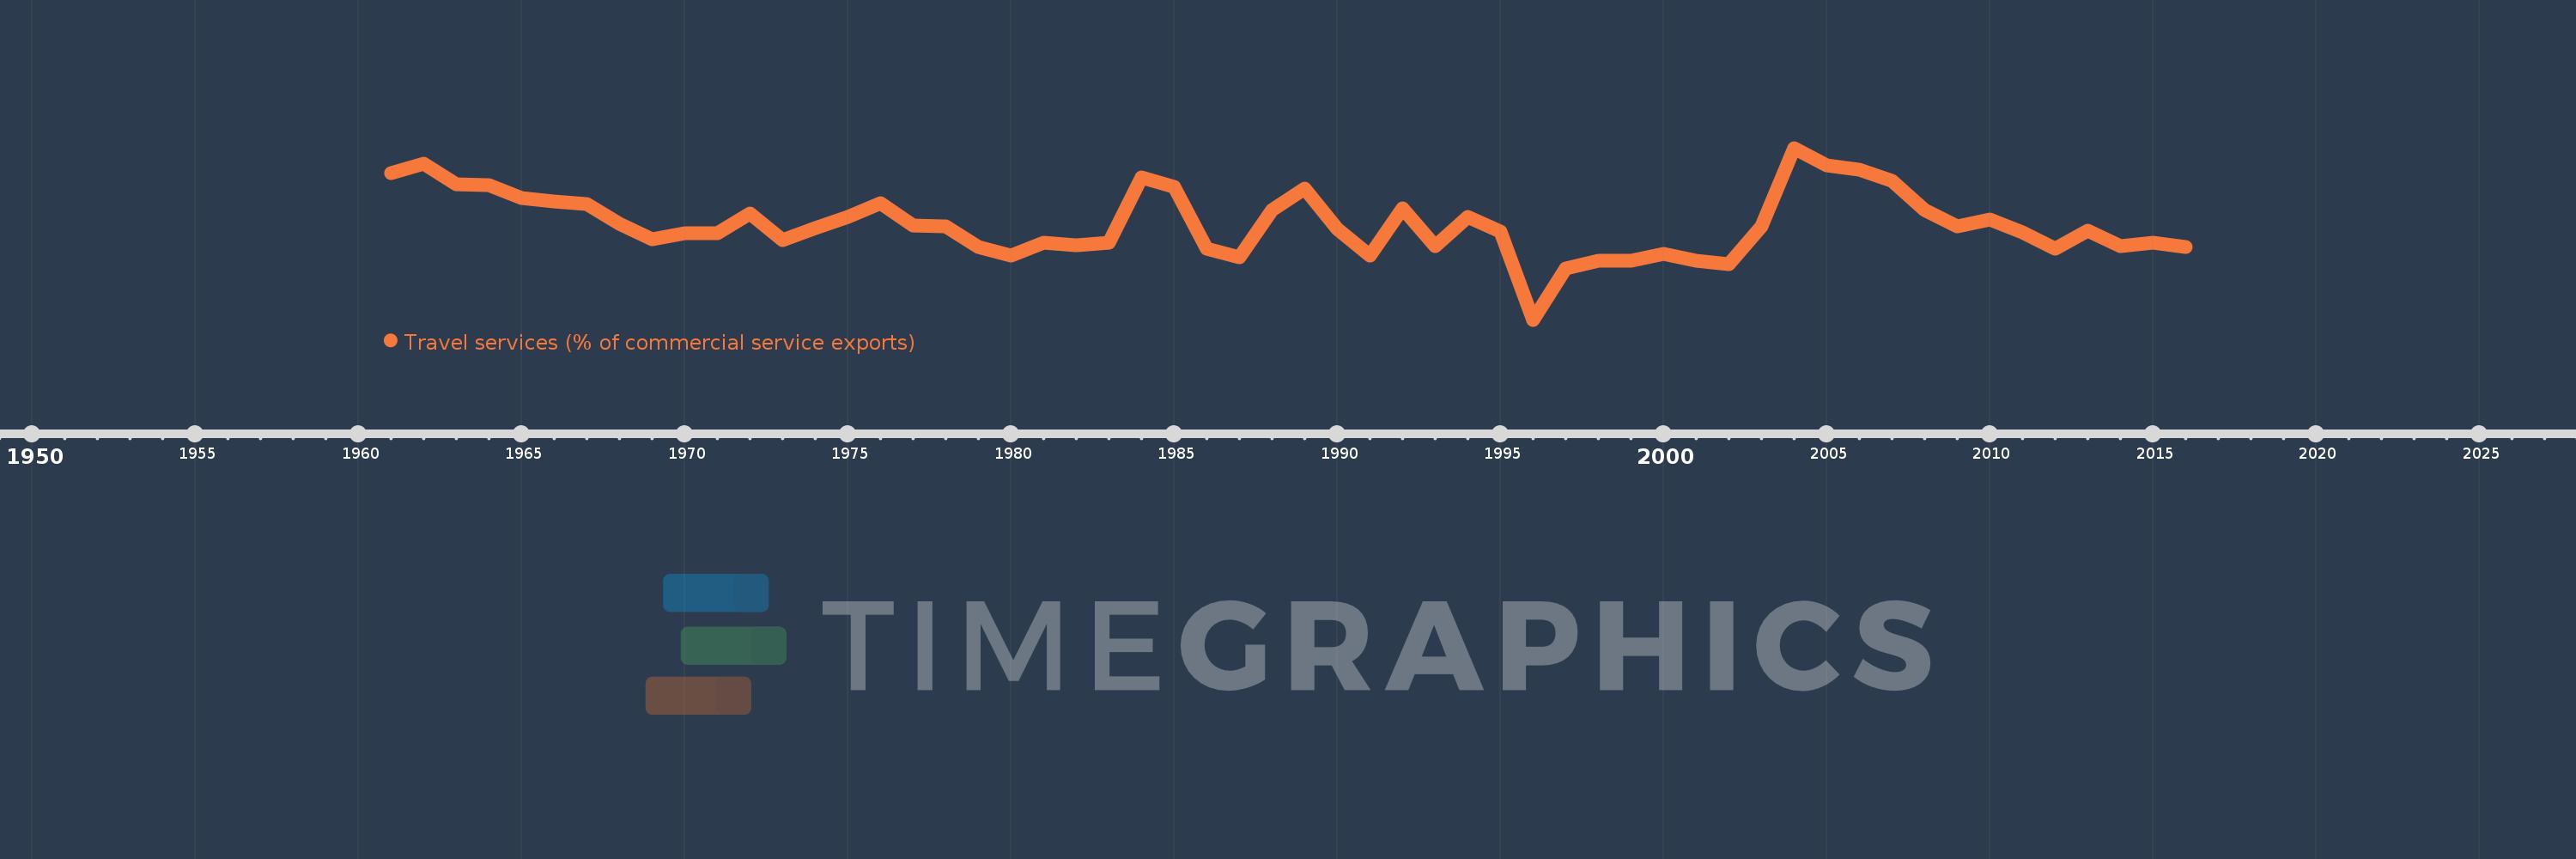
Travel services (% of commercial service exports)
2016,2015,2014,2013,2012,2011,2010,2009,2008,2007,2006,2005,2004,2003,2002,2001,2000,1999,1998,1997,1996,1995,1994,1993,1992,1991,1990,1989,1988,1987,1986,1985,1984,1983,1982,1981,1980,1979,1978,1977,1976,1975,1974,1973,1972,1971,1970,1969,1968,1967,1966,1965,1964,1963,1962,1961
This statistics in other country:
AfghanistanAlbaniaAlgeriaAngolaAntigua and BarbudaArab WorldArgentinaArmeniaArubaAustraliaAustriaAzerbaijanBahamas, TheBahrainBangladeshBarbadosBelarusBelgiumBelizeBeninBermudaBhutanBoliviaBosnia and HerzegovinaBotswanaBrazilBrunei DarussalamBulgariaBurkina FasoBurundiCabo VerdeCambodiaCameroonCanadaCaribbean small statesCentral African RepublicCentral Europe and the BalticsChadChileChinaColombiaComorosCongo, Dem. Rep.Congo, Rep.Costa RicaCote d'IvoireCroatiaCuracaoCyprusCzech RepublicDenmarkDjiboutiDominicaDominican RepublicEarly-demographic dividendEast Asia & PacificEast Asia & Pacific (excluding high income)East Asia & Pacific (IDA & IBRD countries)EcuadorEgypt, Arab Rep.El SalvadorEritreaEstoniaEthiopiaEuro areaEurope & Central AsiaEurope & Central Asia (excluding high income)Europe & Central Asia (IDA & IBRD countries)European UnionFaroe IslandsFijiFinlandFragile and conflict affected situationsFranceFrench PolynesiaGabonGambia, TheGeorgiaGermanyGhanaGreeceGrenadaGuatemalaGuineaGuinea-BissauGuyanaHaitiHeavily indebted poor countries (HIPC)High incomeHondurasHong Kong SAR, ChinaHungaryIBRD onlyIcelandIDA & IBRD totalIDA onlyIDA totalIndiaIndonesiaIran, Islamic Rep.IraqIrelandIsraelItalyJamaicaJapanJordanKazakhstanKenyaKiribatiKorea, Rep.KosovoKuwaitKyrgyz RepublicLao PDRLate-demographic dividendLatin America & Caribbean Latin America & Caribbean (excluding high income)Latin America & the Caribbean (IDA & IBRD countries)LatviaLeast developed countries: UN classificationLebanonLesothoLiberiaLibyaLithuaniaLow & middle incomeLow incomeLower middle incomeLuxembourgMacao SAR, ChinaMacedonia, FYRMadagascarMalawiMalaysiaMaldivesMaliMaltaMarshall IslandsMauritaniaMauritiusMexicoMicronesia, Fed. Sts.Middle East & North Africa (excluding high income)Middle East & North Africa (IDA & IBRD countries)Middle incomeMoldovaMongoliaMontenegroMoroccoMozambiqueMyanmarNamibiaNepalNetherlandsNew CaledoniaNew ZealandNicaraguaNigerNigeriaNorth AmericaNorwayOECD membersOmanOther small statesPacific island small statesPakistanPalauPanamaPapua New GuineaParaguayPeruPhilippinesPolandPortugalPost-demographic dividendPre-demographic dividendQatarRomaniaRussian FederationRwandaSamoaSao Tome and PrincipeSaudi ArabiaSenegalSerbiaSeychellesSierra LeoneSingaporeSint Maarten (Dutch part)Slovak RepublicSloveniaSmall statesSolomon IslandsSouth AfricaSouth AsiaSouth Asia (IDA & IBRD)South SudanSpainSri LankaSt. Kitts and NevisSt. LuciaSt. Vincent and the GrenadinesSub-Saharan Africa Sub-Saharan Africa (excluding high income)Sub-Saharan Africa (IDA & IBRD countries)SudanSurinameSwazilandSwedenSwitzerlandSyrian Arab RepublicTajikistanTanzaniaThailandTimor-LesteTogoTongaTrinidad and TobagoTunisiaTurkeyTuvaluUgandaUkraineUnited KingdomUnited StatesUpper middle incomeUruguayVanuatuVenezuela, RBWest Bank and GazaWorldYemen, Rep.ZambiaZimbabwe Timeline:
This timeline shows a graph from 1961 to 2016 of South Africa. No data until 1960. Number of actual observations by date: 56.
Source name:
World Development Indicators
Source organization:
International Monetary Fund, Balance of Payments Statistics Yearbook and data files.
Categories, topics:
Private Sector, Trade
Last updated:
apr 23, 2017
Indicators value changes by year
Minimum:
48.164
jan 1, 1996
Maximum:
67.358
jan 1, 2004
At the date of observation
Value
Absolute change
Change from previous value
jan 1, 1961
64.571
+64.571
0.0%
jan 1, 1962
65.556
+0.984
1.52%
jan 1, 1963
63.298
-2.258
-3.44%
jan 1, 1964
63.208
-0.09
-0.14%
jan 1, 1965
61.751
-1.456
-2.3%
jan 1, 1966
61.404
-0.348
-0.56%
jan 1, 1967
61.132
-0.271
-0.44%
jan 1, 1968
58.863
-2.269
-3.71%
jan 1, 1969
57.187
-1.676
-2.85%
jan 1, 1970
57.79
+0.604
1.06%
jan 1, 1971
57.805
+0.015
0.03%
jan 1, 1972
60.0
+2.195
3.8%
jan 1, 1973
57.073
-2.927
-4.88%
jan 1, 1974
58.397
+1.325
2.32%
jan 1, 1975
59.624
+1.227
2.1%
jan 1, 1976
61.205
+1.581
2.65%
jan 1, 1977
58.649
-2.556
-4.18%
jan 1, 1978
58.618
-0.031
-0.05%
jan 1, 1979
56.297
-2.321
-3.96%
jan 1, 1980
55.351
-0.946
-1.68%
jan 1, 1981
56.79
+1.439
2.6%
jan 1, 1982
56.463
-0.327
-0.58%
jan 1, 1983
56.784
+0.32
0.57%
jan 1, 1984
64.087
+7.303
12.86%
jan 1, 1985
62.967
-1.12
-1.75%
jan 1, 1986
56.078
-6.889
-10.94%
jan 1, 1987
55.112
-0.967
-1.72%
jan 1, 1988
60.417
+5.305
9.63%
jan 1, 1989
62.821
+2.404
3.98%
jan 1, 1990
58.308
-4.512
-7.18%
jan 1, 1991
55.323
-2.985
-5.12%
jan 1, 1992
60.574
+5.251
9.49%
jan 1, 1993
56.374
-4.2
-6.93%
jan 1, 1994
59.667
+3.293
5.84%
jan 1, 1995
58.026
-1.641
-2.75%
jan 1, 1996
48.164
-9.862
-17.0%
jan 1, 1997
53.937
+5.773
11.99%
jan 1, 1998
54.711
+0.774
1.44%
jan 1, 1999
54.752
+0.04
0.07%
jan 1, 2000
55.541
+0.79
1.44%
jan 1, 2001
54.756
-0.785
-1.41%
jan 1, 2002
54.338
-0.418
-0.76%
jan 1, 2003
58.598
+4.259
7.84%
jan 1, 2004
67.358
+8.76
14.95%
jan 1, 2005
65.381
-1.976
-2.93%
jan 1, 2006
64.961
-0.42
-0.64%
jan 1, 2007
63.649
-1.312
-2.02%
jan 1, 2008
60.465
-3.184
-5.0%
jan 1, 2009
58.553
-1.911
-3.16%
jan 1, 2010
59.397
+0.844
1.44%
jan 1, 2011
57.952
-1.445
-2.43%
jan 1, 2012
56.135
-1.817
-3.14%
jan 1, 2013
58.106
+1.971
3.51%
jan 1, 2014
56.367
-1.739
-2.99%
jan 1, 2015
56.741
+0.373
0.66%
jan 1, 2016
56.314
-0.426
-0.75%
Ranking of countries by current statistics by years


Comments: