29
/
en
AIzaSyAYiBZKx7MnpbEhh9jyipgxe19OcubqV5w
April 1, 2024
165658
Jordan
JOR
true
2
1
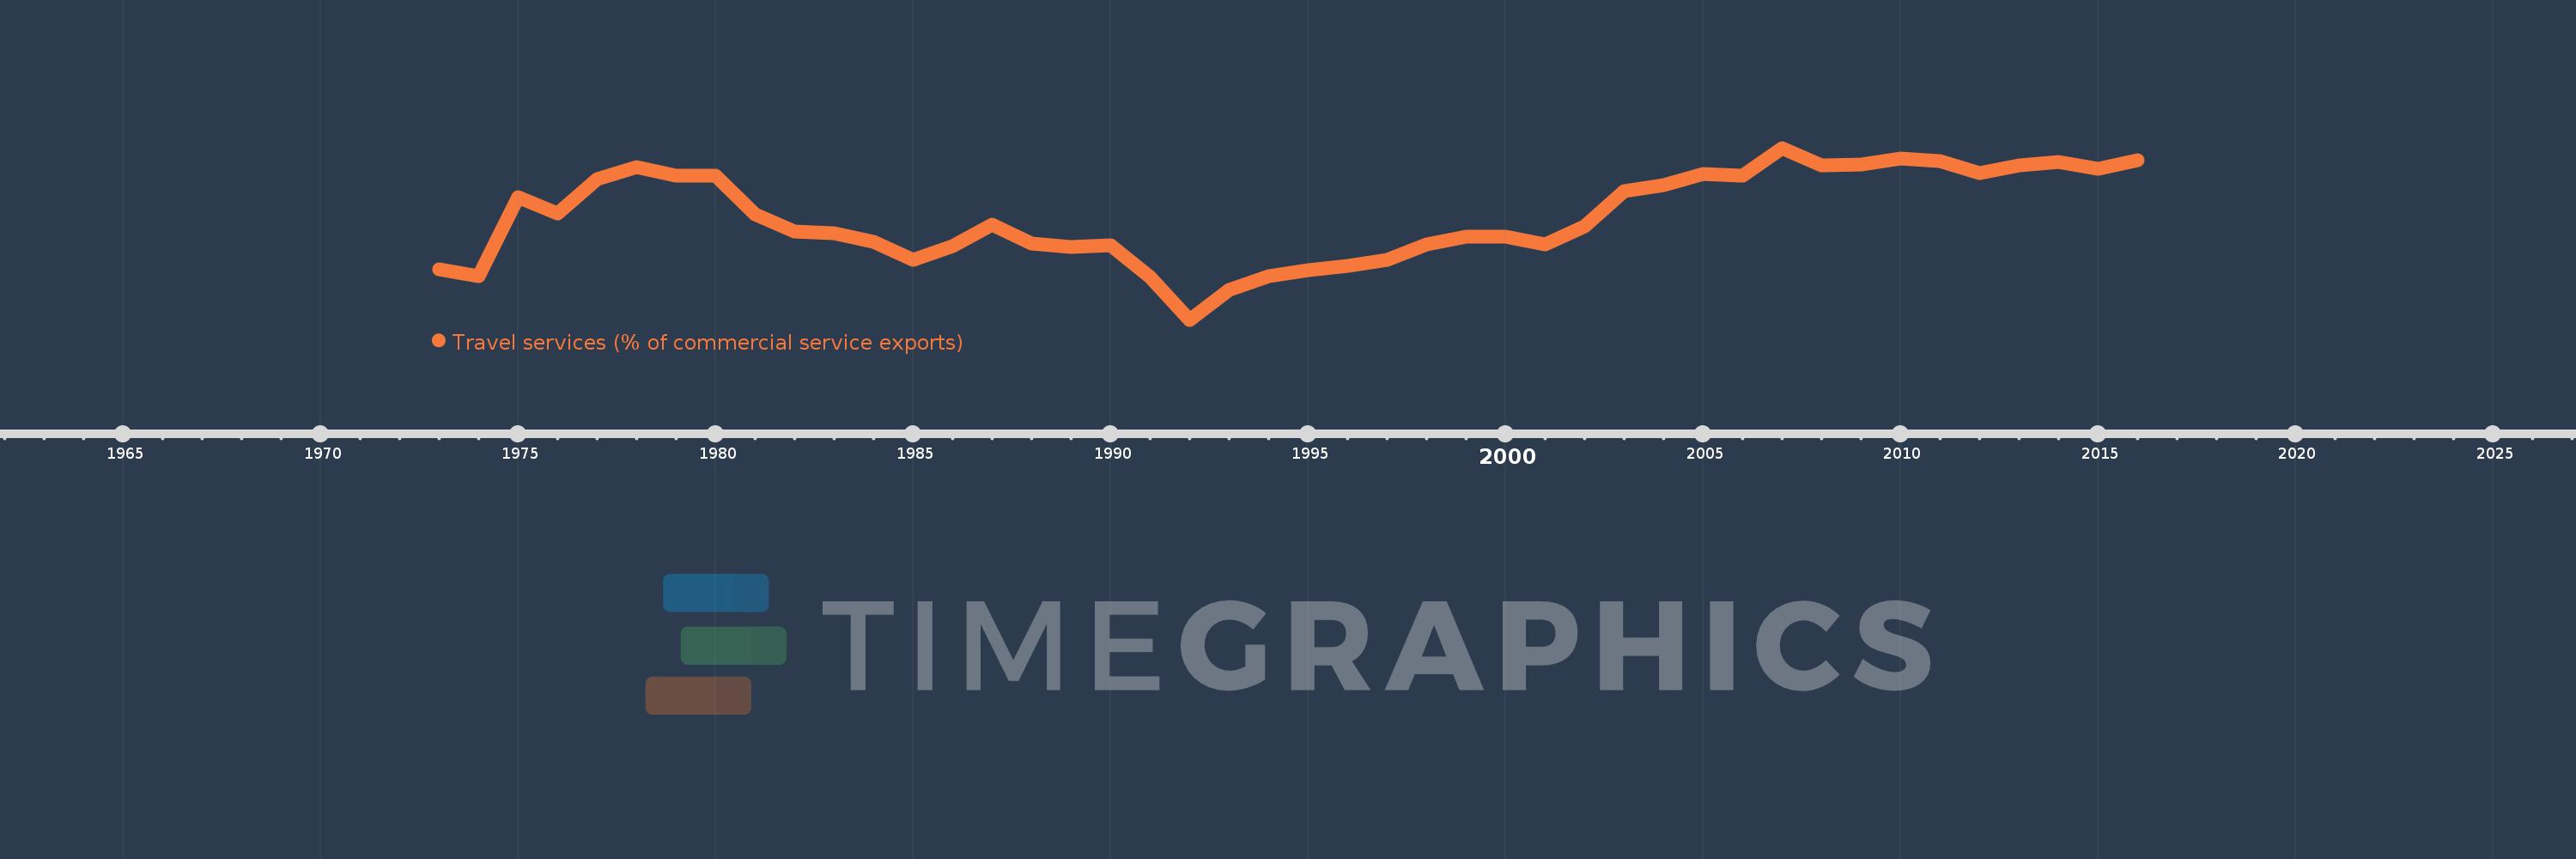
Travel services (% of commercial service exports)
2016,2015,2014,2013,2012,2011,2010,2009,2008,2007,2006,2005,2004,2003,2002,2001,2000,1999,1998,1997,1996,1995,1994,1993,1992,1991,1990,1989,1988,1987,1986,1985,1984,1983,1982,1981,1980,1979,1978,1977,1976,1975,1974,1973
This statistics in other country:
AfghanistanAlbaniaAlgeriaAngolaAntigua and BarbudaArab WorldArgentinaArmeniaArubaAustraliaAustriaAzerbaijanBahamas, TheBahrainBangladeshBarbadosBelarusBelgiumBelizeBeninBermudaBhutanBoliviaBosnia and HerzegovinaBotswanaBrazilBrunei DarussalamBulgariaBurkina FasoBurundiCabo VerdeCambodiaCameroonCanadaCaribbean small statesCentral African RepublicCentral Europe and the BalticsChadChileChinaColombiaComorosCongo, Dem. Rep.Congo, Rep.Costa RicaCote d'IvoireCroatiaCuracaoCyprusCzech RepublicDenmarkDjiboutiDominicaDominican RepublicEarly-demographic dividendEast Asia & PacificEast Asia & Pacific (excluding high income)East Asia & Pacific (IDA & IBRD countries)EcuadorEgypt, Arab Rep.El SalvadorEritreaEstoniaEthiopiaEuro areaEurope & Central AsiaEurope & Central Asia (excluding high income)Europe & Central Asia (IDA & IBRD countries)European UnionFaroe IslandsFijiFinlandFragile and conflict affected situationsFranceFrench PolynesiaGabonGambia, TheGeorgiaGermanyGhanaGreeceGrenadaGuatemalaGuineaGuinea-BissauGuyanaHaitiHeavily indebted poor countries (HIPC)High incomeHondurasHong Kong SAR, ChinaHungaryIBRD onlyIcelandIDA & IBRD totalIDA onlyIDA totalIndiaIndonesiaIran, Islamic Rep.IraqIrelandIsraelItalyJamaicaJapanJordanKazakhstanKenyaKiribatiKorea, Rep.KosovoKuwaitKyrgyz RepublicLao PDRLate-demographic dividendLatin America & Caribbean Latin America & Caribbean (excluding high income)Latin America & the Caribbean (IDA & IBRD countries)LatviaLeast developed countries: UN classificationLebanonLesothoLiberiaLibyaLithuaniaLow & middle incomeLow incomeLower middle incomeLuxembourgMacao SAR, ChinaMacedonia, FYRMadagascarMalawiMalaysiaMaldivesMaliMaltaMarshall IslandsMauritaniaMauritiusMexicoMicronesia, Fed. Sts.Middle East & North Africa (excluding high income)Middle East & North Africa (IDA & IBRD countries)Middle incomeMoldovaMongoliaMontenegroMoroccoMozambiqueMyanmarNamibiaNepalNetherlandsNew CaledoniaNew ZealandNicaraguaNigerNigeriaNorth AmericaNorwayOECD membersOmanOther small statesPacific island small statesPakistanPalauPanamaPapua New GuineaParaguayPeruPhilippinesPolandPortugalPost-demographic dividendPre-demographic dividendQatarRomaniaRussian FederationRwandaSamoaSao Tome and PrincipeSaudi ArabiaSenegalSerbiaSeychellesSierra LeoneSingaporeSint Maarten (Dutch part)Slovak RepublicSloveniaSmall statesSolomon IslandsSouth AfricaSouth AsiaSouth Asia (IDA & IBRD)South SudanSpainSri LankaSt. Kitts and NevisSt. LuciaSt. Vincent and the GrenadinesSub-Saharan Africa Sub-Saharan Africa (excluding high income)Sub-Saharan Africa (IDA & IBRD countries)SudanSurinameSwazilandSwedenSwitzerlandSyrian Arab RepublicTajikistanTanzaniaThailandTimor-LesteTogoTongaTrinidad and TobagoTunisiaTurkeyTuvaluUgandaUkraineUnited KingdomUnited StatesUpper middle incomeUruguayVanuatuVenezuela, RBWest Bank and GazaWorldYemen, Rep.ZambiaZimbabwe Timeline:
This timeline shows a graph from 1973 to 2016 of Jordan. No data until 1972. Number of actual observations by date: 44.
Source name:
World Development Indicators
Source organization:
International Monetary Fund, Balance of Payments Statistics Yearbook and data files.
Categories, topics:
Private Sector, Trade
Last updated:
apr 23, 2017
Indicators value changes by year
Minimum:
23.757
jan 1, 1992
Maximum:
72.288
jan 1, 2007
At the date of observation
Value
Absolute change
Change from previous value
jan 1, 1973
38.073
+38.073
0.0%
jan 1, 1974
36.149
-1.925
-5.06%
jan 1, 1975
58.446
+22.297
61.68%
jan 1, 1976
53.684
-4.762
-8.15%
jan 1, 1977
63.444
+9.76
18.18%
jan 1, 1978
66.874
+3.431
5.41%
jan 1, 1979
64.347
-2.528
-3.78%
jan 1, 1980
64.377
+0.03
0.05%
jan 1, 1981
53.445
-10.932
-16.98%
jan 1, 1982
48.602
-4.843
-9.06%
jan 1, 1983
48.146
-0.457
-0.94%
jan 1, 1984
45.716
-2.429
-5.05%
jan 1, 1985
40.593
-5.124
-11.21%
jan 1, 1986
44.642
+4.049
9.98%
jan 1, 1987
50.733
+6.091
13.64%
jan 1, 1988
45.223
-5.51
-10.86%
jan 1, 1989
44.413
-0.81
-1.79%
jan 1, 1990
44.694
+0.281
0.63%
jan 1, 1991
35.748
-8.946
-20.02%
jan 1, 1992
23.757
-11.991
-33.54%
jan 1, 1993
32.276
+8.519
35.86%
jan 1, 1994
36.089
+3.813
11.81%
jan 1, 1995
37.71
+1.621
4.49%
jan 1, 1996
39.082
+1.372
3.64%
jan 1, 1997
40.629
+1.547
3.96%
jan 1, 1998
45.094
+4.466
10.99%
jan 1, 1999
47.124
+2.03
4.5%
jan 1, 2000
47.11
-0.014
-0.03%
jan 1, 2001
45.122
-1.988
-4.22%
jan 1, 2002
50.111
+4.99
11.06%
jan 1, 2003
60.157
+10.046
20.05%
jan 1, 2004
61.836
+1.679
2.79%
jan 1, 2005
64.815
+2.98
4.82%
jan 1, 2006
64.34
-0.475
-0.73%
jan 1, 2007
72.288
+7.948
12.35%
jan 1, 2008
67.248
-5.04
-6.97%
jan 1, 2009
67.596
+0.347
0.52%
jan 1, 2010
69.365
+1.769
2.62%
jan 1, 2011
68.669
-0.696
-1.0%
jan 1, 2012
65.231
-3.438
-5.01%
jan 1, 2013
67.355
+2.124
3.26%
jan 1, 2014
68.226
+0.871
1.29%
jan 1, 2015
66.328
-1.898
-2.78%
jan 1, 2016
68.713
+2.385
3.6%
Ranking of countries by current statistics by years


Comments: