29
/
en
AIzaSyAYiBZKx7MnpbEhh9jyipgxe19OcubqV5w
April 1, 2024
153187
Hungary
HUN
true
2
1
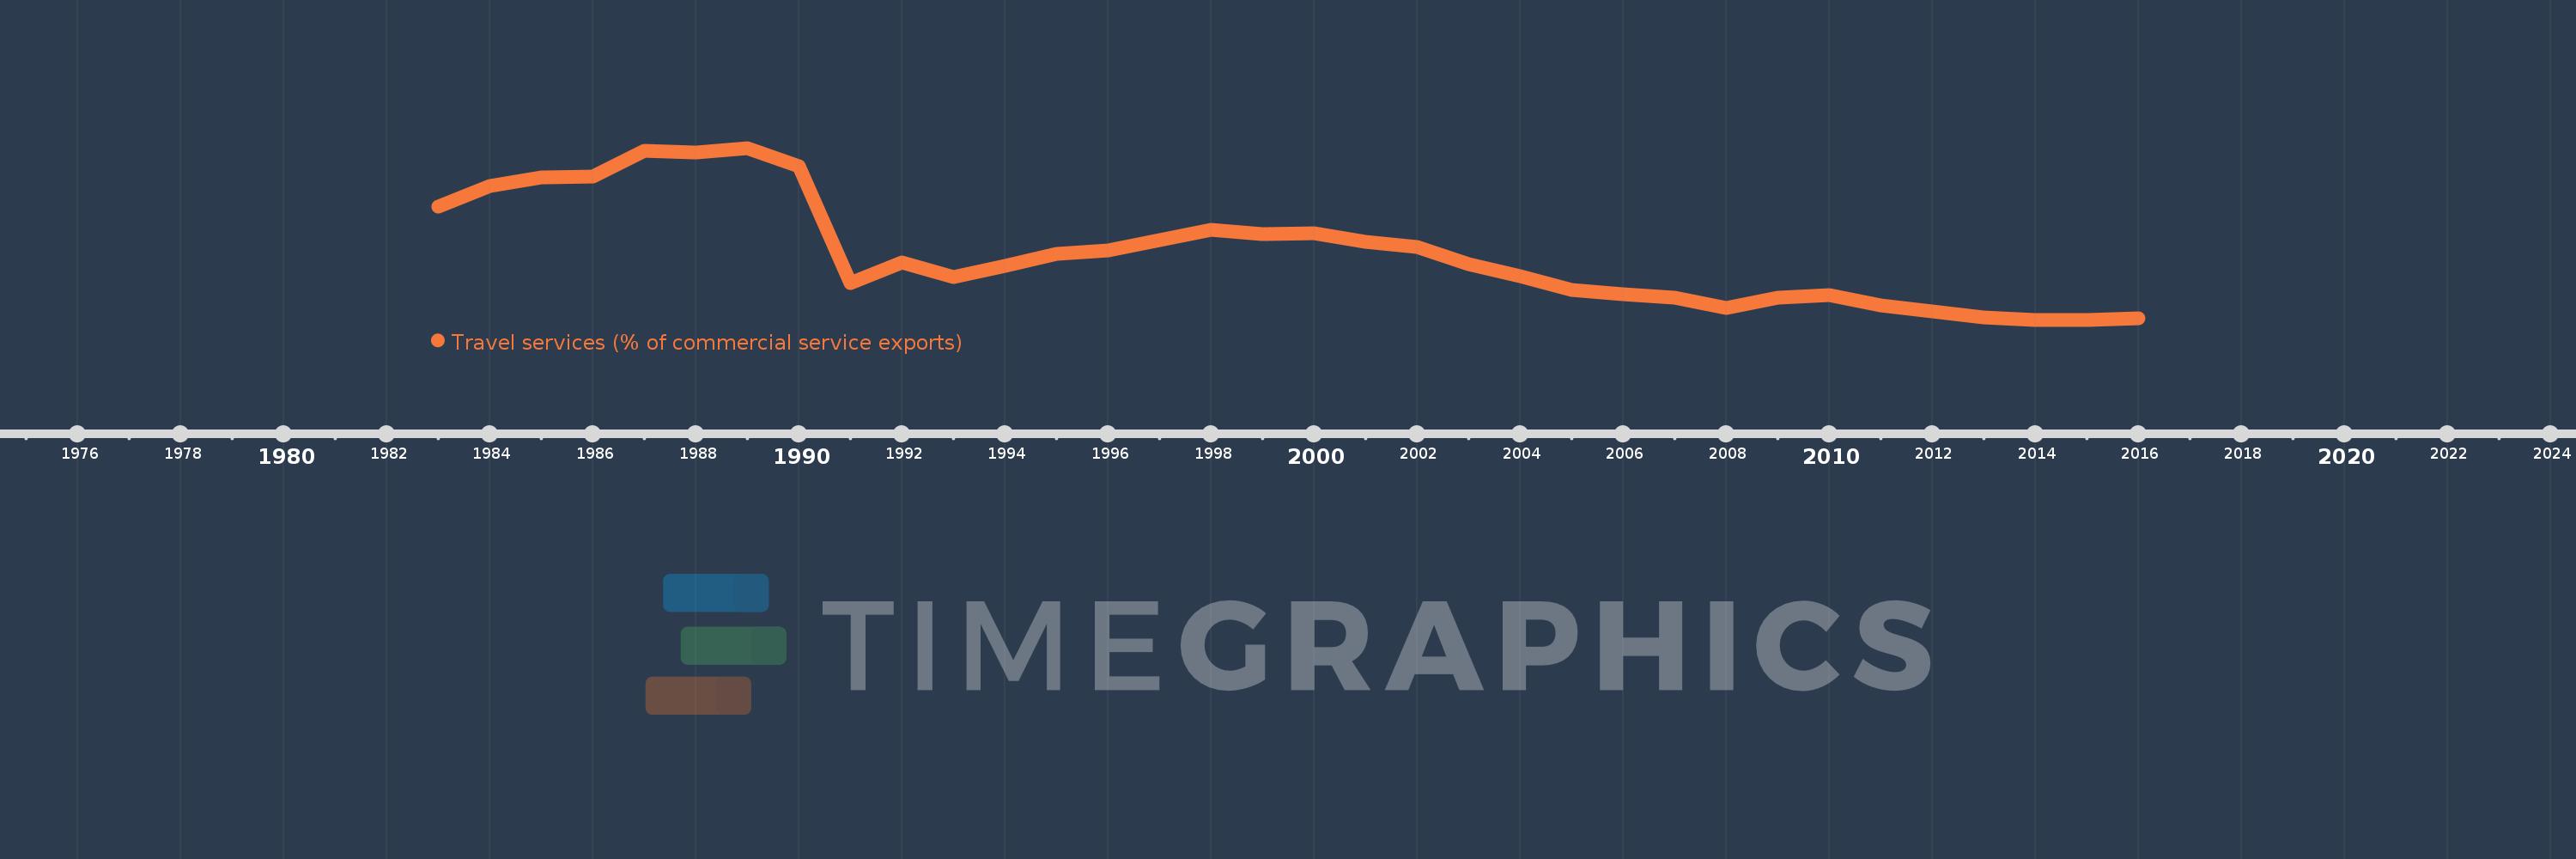
Travel services (% of commercial service exports)
2016,2015,2014,2013,2012,2011,2010,2009,2008,2007,2006,2005,2004,2003,2002,2001,2000,1999,1998,1997,1996,1995,1994,1993,1992,1991,1990,1989,1988,1987,1986,1985,1984,1983
This statistics in other country:
AfghanistanAlbaniaAlgeriaAngolaAntigua and BarbudaArab WorldArgentinaArmeniaArubaAustraliaAustriaAzerbaijanBahamas, TheBahrainBangladeshBarbadosBelarusBelgiumBelizeBeninBermudaBhutanBoliviaBosnia and HerzegovinaBotswanaBrazilBrunei DarussalamBulgariaBurkina FasoBurundiCabo VerdeCambodiaCameroonCanadaCaribbean small statesCentral African RepublicCentral Europe and the BalticsChadChileChinaColombiaComorosCongo, Dem. Rep.Congo, Rep.Costa RicaCote d'IvoireCroatiaCuracaoCyprusCzech RepublicDenmarkDjiboutiDominicaDominican RepublicEarly-demographic dividendEast Asia & PacificEast Asia & Pacific (excluding high income)East Asia & Pacific (IDA & IBRD countries)EcuadorEgypt, Arab Rep.El SalvadorEritreaEstoniaEthiopiaEuro areaEurope & Central AsiaEurope & Central Asia (excluding high income)Europe & Central Asia (IDA & IBRD countries)European UnionFaroe IslandsFijiFinlandFragile and conflict affected situationsFranceFrench PolynesiaGabonGambia, TheGeorgiaGermanyGhanaGreeceGrenadaGuatemalaGuineaGuinea-BissauGuyanaHaitiHeavily indebted poor countries (HIPC)High incomeHondurasHong Kong SAR, ChinaHungaryIBRD onlyIcelandIDA & IBRD totalIDA onlyIDA totalIndiaIndonesiaIran, Islamic Rep.IraqIrelandIsraelItalyJamaicaJapanJordanKazakhstanKenyaKiribatiKorea, Rep.KosovoKuwaitKyrgyz RepublicLao PDRLate-demographic dividendLatin America & Caribbean Latin America & Caribbean (excluding high income)Latin America & the Caribbean (IDA & IBRD countries)LatviaLeast developed countries: UN classificationLebanonLesothoLiberiaLibyaLithuaniaLow & middle incomeLow incomeLower middle incomeLuxembourgMacao SAR, ChinaMacedonia, FYRMadagascarMalawiMalaysiaMaldivesMaliMaltaMarshall IslandsMauritaniaMauritiusMexicoMicronesia, Fed. Sts.Middle East & North Africa (excluding high income)Middle East & North Africa (IDA & IBRD countries)Middle incomeMoldovaMongoliaMontenegroMoroccoMozambiqueMyanmarNamibiaNepalNetherlandsNew CaledoniaNew ZealandNicaraguaNigerNigeriaNorth AmericaNorwayOECD membersOmanOther small statesPacific island small statesPakistanPalauPanamaPapua New GuineaParaguayPeruPhilippinesPolandPortugalPost-demographic dividendPre-demographic dividendQatarRomaniaRussian FederationRwandaSamoaSao Tome and PrincipeSaudi ArabiaSenegalSerbiaSeychellesSierra LeoneSingaporeSint Maarten (Dutch part)Slovak RepublicSloveniaSmall statesSolomon IslandsSouth AfricaSouth AsiaSouth Asia (IDA & IBRD)South SudanSpainSri LankaSt. Kitts and NevisSt. LuciaSt. Vincent and the GrenadinesSub-Saharan Africa Sub-Saharan Africa (excluding high income)Sub-Saharan Africa (IDA & IBRD countries)SudanSurinameSwazilandSwedenSwitzerlandSyrian Arab RepublicTajikistanTanzaniaThailandTimor-LesteTogoTongaTrinidad and TobagoTunisiaTurkeyTuvaluUgandaUkraineUnited KingdomUnited StatesUpper middle incomeUruguayVanuatuVenezuela, RBWest Bank and GazaWorldYemen, Rep.ZambiaZimbabwe Timeline:
This timeline shows a graph from 1983 to 2016 of Hungary. No data until 1982. Number of actual observations by date: 34.
Source name:
World Development Indicators
Source organization:
International Monetary Fund, Balance of Payments Statistics Yearbook and data files.
Categories, topics:
Private Sector, Trade
Last updated:
apr 23, 2017
Indicators value changes by year
Minimum:
23.845
jan 1, 2015
Maximum:
84.307
jan 1, 1989
At the date of observation
Value
Absolute change
Change from previous value
jan 1, 1983
63.81
+63.81
0.0%
jan 1, 1984
71.013
+7.204
11.29%
jan 1, 1985
73.855
+2.842
4.0%
jan 1, 1986
74.351
+0.496
0.67%
jan 1, 1987
83.174
+8.823
11.87%
jan 1, 1988
82.855
-0.319
-0.38%
jan 1, 1989
84.307
+1.452
1.75%
jan 1, 1990
77.914
-6.393
-7.58%
jan 1, 1991
36.815
-41.099
-52.75%
jan 1, 1992
44.015
+7.2
19.56%
jan 1, 1993
38.904
-5.111
-11.61%
jan 1, 1994
42.918
+4.014
10.32%
jan 1, 1995
47.095
+4.177
9.73%
jan 1, 1996
48.339
+1.243
2.64%
jan 1, 1997
51.787
+3.449
7.13%
jan 1, 1998
55.429
+3.642
7.03%
jan 1, 1999
53.96
-1.469
-2.65%
jan 1, 2000
54.236
+0.276
0.51%
jan 1, 2001
51.353
-2.882
-5.31%
jan 1, 2002
49.569
-1.784
-3.47%
jan 1, 2003
43.265
-6.305
-12.72%
jan 1, 2004
39.105
-4.16
-9.62%
jan 1, 2005
34.347
-4.758
-12.17%
jan 1, 2006
32.912
-1.435
-4.18%
jan 1, 2007
31.58
-1.332
-4.05%
jan 1, 2008
27.963
-3.617
-11.45%
jan 1, 2009
31.659
+3.696
13.22%
jan 1, 2010
32.43
+0.771
2.44%
jan 1, 2011
28.968
-3.462
-10.68%
jan 1, 2012
26.693
-2.276
-7.86%
jan 1, 2013
24.677
-2.015
-7.55%
jan 1, 2014
23.892
-0.785
-3.18%
jan 1, 2015
23.845
-0.047
-0.2%
jan 1, 2016
24.259
+0.413
1.73%
Ranking of countries by current statistics by years


Comments: