29
/
en
AIzaSyAYiBZKx7MnpbEhh9jyipgxe19OcubqV5w
April 1, 2024
170595
Korea, Rep.
KOR
true
2
1
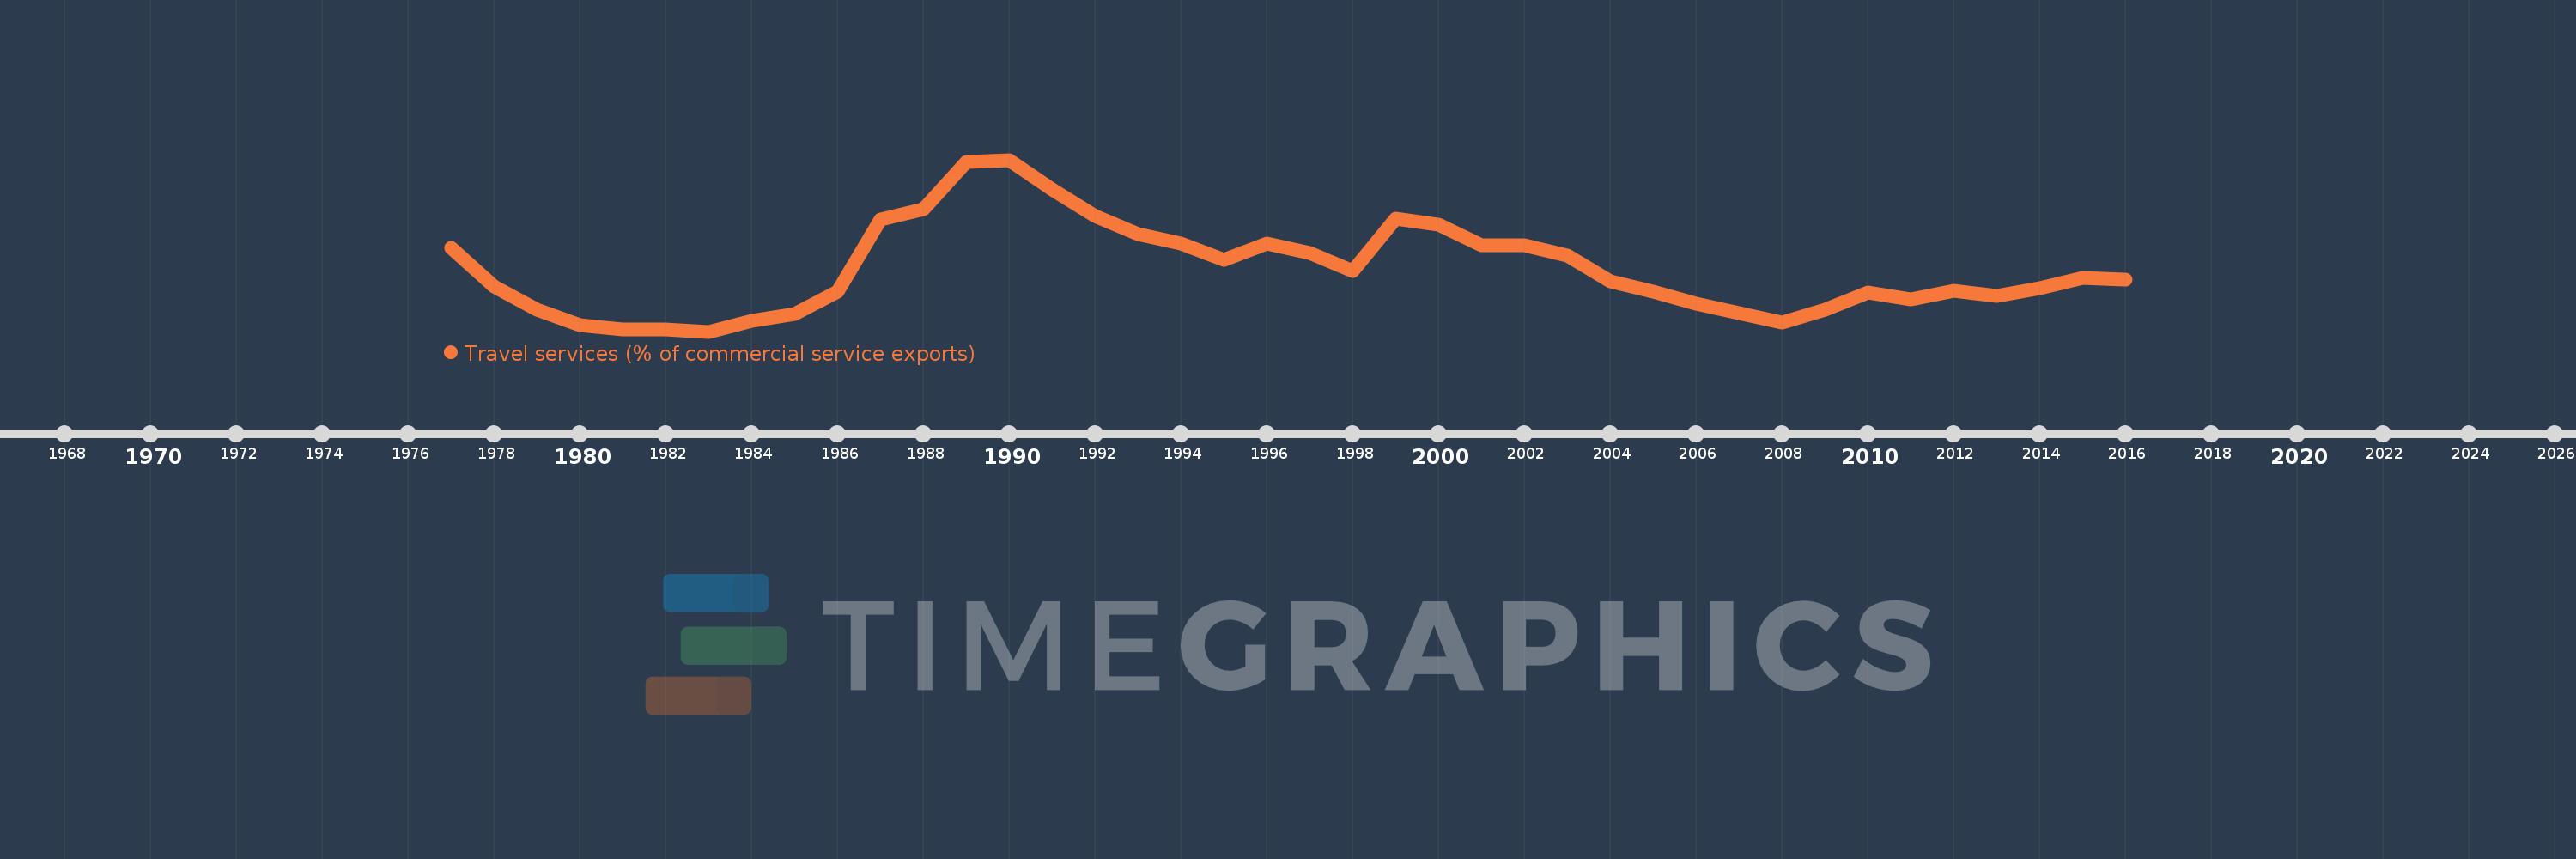
Travel services (% of commercial service exports)
2016,2015,2014,2013,2012,2011,2010,2009,2008,2007,2006,2005,2004,2003,2002,2001,2000,1999,1998,1997,1996,1995,1994,1993,1992,1991,1990,1989,1988,1987,1986,1985,1984,1983,1982,1981,1980,1979,1978,1977
This statistics in other country:
AfghanistanAlbaniaAlgeriaAngolaAntigua and BarbudaArab WorldArgentinaArmeniaArubaAustraliaAustriaAzerbaijanBahamas, TheBahrainBangladeshBarbadosBelarusBelgiumBelizeBeninBermudaBhutanBoliviaBosnia and HerzegovinaBotswanaBrazilBrunei DarussalamBulgariaBurkina FasoBurundiCabo VerdeCambodiaCameroonCanadaCaribbean small statesCentral African RepublicCentral Europe and the BalticsChadChileChinaColombiaComorosCongo, Dem. Rep.Congo, Rep.Costa RicaCote d'IvoireCroatiaCuracaoCyprusCzech RepublicDenmarkDjiboutiDominicaDominican RepublicEarly-demographic dividendEast Asia & PacificEast Asia & Pacific (excluding high income)East Asia & Pacific (IDA & IBRD countries)EcuadorEgypt, Arab Rep.El SalvadorEritreaEstoniaEthiopiaEuro areaEurope & Central AsiaEurope & Central Asia (excluding high income)Europe & Central Asia (IDA & IBRD countries)European UnionFaroe IslandsFijiFinlandFragile and conflict affected situationsFranceFrench PolynesiaGabonGambia, TheGeorgiaGermanyGhanaGreeceGrenadaGuatemalaGuineaGuinea-BissauGuyanaHaitiHeavily indebted poor countries (HIPC)High incomeHondurasHong Kong SAR, ChinaHungaryIBRD onlyIcelandIDA & IBRD totalIDA onlyIDA totalIndiaIndonesiaIran, Islamic Rep.IraqIrelandIsraelItalyJamaicaJapanJordanKazakhstanKenyaKiribatiKorea, Rep.KosovoKuwaitKyrgyz RepublicLao PDRLate-demographic dividendLatin America & Caribbean Latin America & Caribbean (excluding high income)Latin America & the Caribbean (IDA & IBRD countries)LatviaLeast developed countries: UN classificationLebanonLesothoLiberiaLibyaLithuaniaLow & middle incomeLow incomeLower middle incomeLuxembourgMacao SAR, ChinaMacedonia, FYRMadagascarMalawiMalaysiaMaldivesMaliMaltaMarshall IslandsMauritaniaMauritiusMexicoMicronesia, Fed. Sts.Middle East & North Africa (excluding high income)Middle East & North Africa (IDA & IBRD countries)Middle incomeMoldovaMongoliaMontenegroMoroccoMozambiqueMyanmarNamibiaNepalNetherlandsNew CaledoniaNew ZealandNicaraguaNigerNigeriaNorth AmericaNorwayOECD membersOmanOther small statesPacific island small statesPakistanPalauPanamaPapua New GuineaParaguayPeruPhilippinesPolandPortugalPost-demographic dividendPre-demographic dividendQatarRomaniaRussian FederationRwandaSamoaSao Tome and PrincipeSaudi ArabiaSenegalSerbiaSeychellesSierra LeoneSingaporeSint Maarten (Dutch part)Slovak RepublicSloveniaSmall statesSolomon IslandsSouth AfricaSouth AsiaSouth Asia (IDA & IBRD)South SudanSpainSri LankaSt. Kitts and NevisSt. LuciaSt. Vincent and the GrenadinesSub-Saharan Africa Sub-Saharan Africa (excluding high income)Sub-Saharan Africa (IDA & IBRD countries)SudanSurinameSwazilandSwedenSwitzerlandSyrian Arab RepublicTajikistanTanzaniaThailandTimor-LesteTogoTongaTrinidad and TobagoTunisiaTurkeyTuvaluUgandaUkraineUnited KingdomUnited StatesUpper middle incomeUruguayVanuatuVenezuela, RBWest Bank and GazaWorldYemen, Rep.ZambiaZimbabwe Timeline:
This timeline shows a graph from 1977 to 2016 of Korea, Rep.. No data until 1976. Number of actual observations by date: 40.
Source name:
World Development Indicators
Source organization:
International Monetary Fund, Balance of Payments Statistics Yearbook and data files.
Categories, topics:
Private Sector, Trade
Last updated:
apr 23, 2017
Indicators value changes by year
Maximum:
35.409
jan 1, 1990
At the date of observation
Value
Absolute change
Change from previous value
jan 1, 1977
20.913
+20.913
0.0%
jan 1, 1978
14.642
-6.271
-29.99%
jan 1, 1979
10.883
-3.759
-25.67%
jan 1, 1980
8.232
-2.651
-24.36%
jan 1, 1981
7.601
-0.631
-7.67%
jan 1, 1982
7.511
-0.091
-1.19%
jan 1, 1983
7.219
-0.292
-3.88%
jan 1, 1984
9.002
+1.783
24.7%
jan 1, 1985
10.071
+1.069
11.88%
jan 1, 1986
13.819
+3.748
37.22%
jan 1, 1987
25.666
+11.847
85.73%
jan 1, 1988
27.329
+1.662
6.48%
jan 1, 1989
35.064
+7.736
28.31%
jan 1, 1990
35.409
+0.345
0.98%
jan 1, 1991
30.586
-4.822
-13.62%
jan 1, 1992
26.197
-4.389
-14.35%
jan 1, 1993
23.261
-2.936
-11.21%
jan 1, 1994
21.717
-1.544
-6.64%
jan 1, 1995
19.054
-2.663
-12.26%
jan 1, 1996
21.632
+2.577
13.53%
jan 1, 1997
20.093
-1.539
-7.11%
jan 1, 1998
17.211
-2.882
-14.35%
jan 1, 1999
25.795
+8.585
49.88%
jan 1, 2000
24.824
-0.972
-3.77%
jan 1, 2001
21.438
-3.386
-13.64%
jan 1, 2002
21.327
-0.111
-0.52%
jan 1, 2003
19.729
-1.598
-7.49%
jan 1, 2004
15.442
-4.287
-21.73%
jan 1, 2005
13.765
-1.677
-10.86%
jan 1, 2006
11.773
-1.992
-14.47%
jan 1, 2007
10.278
-1.495
-12.7%
jan 1, 2008
8.734
-1.545
-15.03%
jan 1, 2009
10.819
+2.085
23.87%
jan 1, 2010
13.685
+2.866
26.49%
jan 1, 2011
12.558
-1.127
-8.24%
jan 1, 2012
13.907
+1.349
10.75%
jan 1, 2013
13.127
-0.78
-5.61%
jan 1, 2014
14.268
+1.141
8.69%
jan 1, 2015
16.074
+1.806
12.66%
jan 1, 2016
15.783
-0.291
-1.81%
Ranking of countries by current statistics by years


Comments: