29
/
en
AIzaSyAYiBZKx7MnpbEhh9jyipgxe19OcubqV5w
April 1, 2024
142429
Greece
GRC
true
2
1
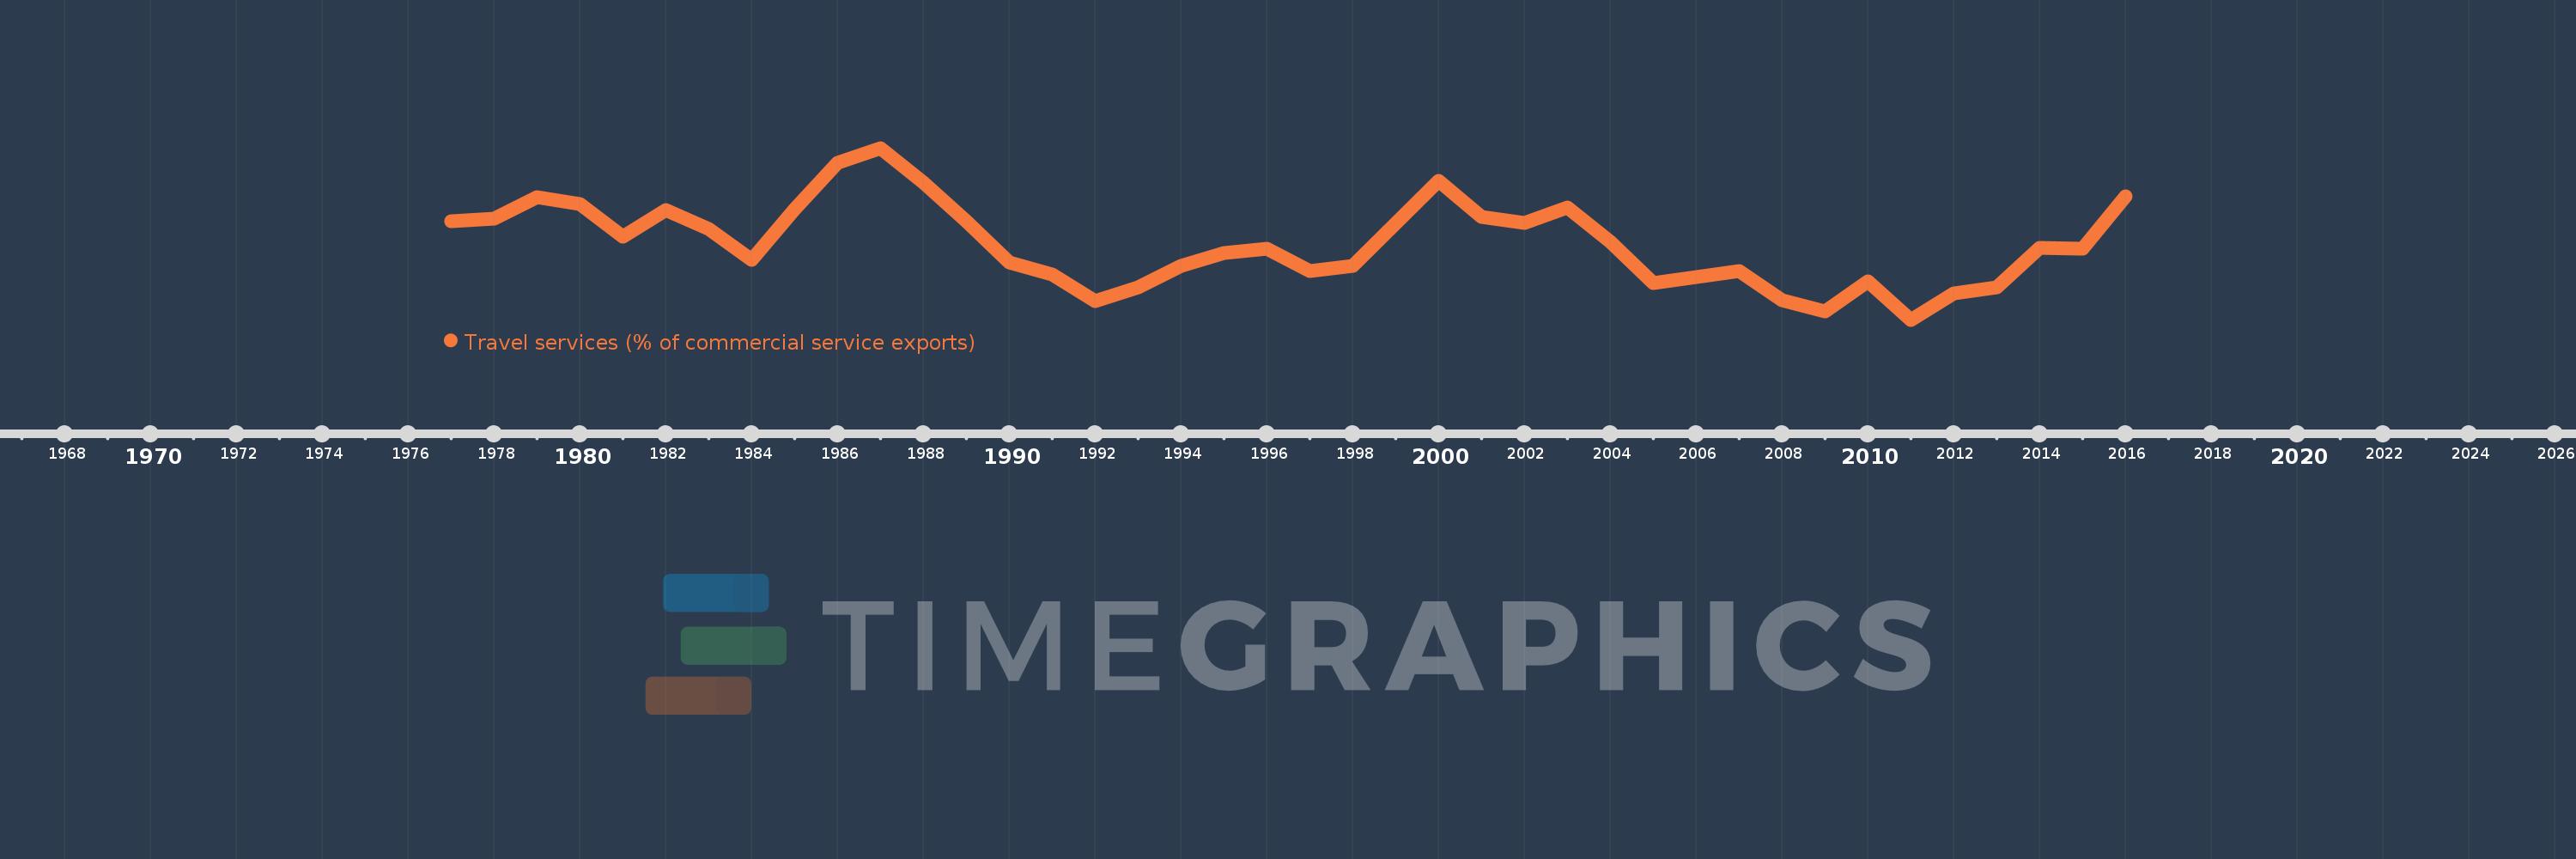
Travel services (% of commercial service exports)
2016,2015,2014,2013,2012,2011,2010,2009,2008,2007,2006,2005,2004,2003,2002,2001,2000,1998,1997,1996,1995,1994,1993,1992,1991,1990,1989,1988,1987,1986,1985,1984,1983,1982,1981,1980,1979,1978,1977
This statistics in other country:
AfghanistanAlbaniaAlgeriaAngolaAntigua and BarbudaArab WorldArgentinaArmeniaArubaAustraliaAustriaAzerbaijanBahamas, TheBahrainBangladeshBarbadosBelarusBelgiumBelizeBeninBermudaBhutanBoliviaBosnia and HerzegovinaBotswanaBrazilBrunei DarussalamBulgariaBurkina FasoBurundiCabo VerdeCambodiaCameroonCanadaCaribbean small statesCentral African RepublicCentral Europe and the BalticsChadChileChinaColombiaComorosCongo, Dem. Rep.Congo, Rep.Costa RicaCote d'IvoireCroatiaCuracaoCyprusCzech RepublicDenmarkDjiboutiDominicaDominican RepublicEarly-demographic dividendEast Asia & PacificEast Asia & Pacific (excluding high income)East Asia & Pacific (IDA & IBRD countries)EcuadorEgypt, Arab Rep.El SalvadorEritreaEstoniaEthiopiaEuro areaEurope & Central AsiaEurope & Central Asia (excluding high income)Europe & Central Asia (IDA & IBRD countries)European UnionFaroe IslandsFijiFinlandFragile and conflict affected situationsFranceFrench PolynesiaGabonGambia, TheGeorgiaGermanyGhanaGreeceGrenadaGuatemalaGuineaGuinea-BissauGuyanaHaitiHeavily indebted poor countries (HIPC)High incomeHondurasHong Kong SAR, ChinaHungaryIBRD onlyIcelandIDA & IBRD totalIDA onlyIDA totalIndiaIndonesiaIran, Islamic Rep.IraqIrelandIsraelItalyJamaicaJapanJordanKazakhstanKenyaKiribatiKorea, Rep.KosovoKuwaitKyrgyz RepublicLao PDRLate-demographic dividendLatin America & Caribbean Latin America & Caribbean (excluding high income)Latin America & the Caribbean (IDA & IBRD countries)LatviaLeast developed countries: UN classificationLebanonLesothoLiberiaLibyaLithuaniaLow & middle incomeLow incomeLower middle incomeLuxembourgMacao SAR, ChinaMacedonia, FYRMadagascarMalawiMalaysiaMaldivesMaliMaltaMarshall IslandsMauritaniaMauritiusMexicoMicronesia, Fed. Sts.Middle East & North Africa (excluding high income)Middle East & North Africa (IDA & IBRD countries)Middle incomeMoldovaMongoliaMontenegroMoroccoMozambiqueMyanmarNamibiaNepalNetherlandsNew CaledoniaNew ZealandNicaraguaNigerNigeriaNorth AmericaNorwayOECD membersOmanOther small statesPacific island small statesPakistanPalauPanamaPapua New GuineaParaguayPeruPhilippinesPolandPortugalPost-demographic dividendPre-demographic dividendQatarRomaniaRussian FederationRwandaSamoaSao Tome and PrincipeSaudi ArabiaSenegalSerbiaSeychellesSierra LeoneSingaporeSint Maarten (Dutch part)Slovak RepublicSloveniaSmall statesSolomon IslandsSouth AfricaSouth AsiaSouth Asia (IDA & IBRD)South SudanSpainSri LankaSt. Kitts and NevisSt. LuciaSt. Vincent and the GrenadinesSub-Saharan Africa Sub-Saharan Africa (excluding high income)Sub-Saharan Africa (IDA & IBRD countries)SudanSurinameSwazilandSwedenSwitzerlandSyrian Arab RepublicTajikistanTanzaniaThailandTimor-LesteTogoTongaTrinidad and TobagoTunisiaTurkeyTuvaluUgandaUkraineUnited KingdomUnited StatesUpper middle incomeUruguayVanuatuVenezuela, RBWest Bank and GazaWorldYemen, Rep.ZambiaZimbabwe Timeline:
This timeline shows a graph from 1977 to 2016 of Greece. No data until 1976. Number of actual observations by date: 39.
Source name:
World Development Indicators
Source organization:
International Monetary Fund, Balance of Payments Statistics Yearbook and data files.
Categories, topics:
Private Sector, Trade
Last updated:
apr 23, 2017
Indicators value changes by year
Minimum:
33.245
jan 1, 2011
Maximum:
57.746
jan 1, 1987
At the date of observation
Value
Absolute change
Change from previous value
jan 1, 1977
47.326
+47.326
0.0%
jan 1, 1978
47.691
+0.365
0.77%
jan 1, 1979
50.688
+2.997
6.28%
jan 1, 1980
49.76
-0.928
-1.83%
jan 1, 1981
45.036
-4.724
-9.49%
jan 1, 1982
48.831
+3.795
8.43%
jan 1, 1983
46.245
-2.586
-5.3%
jan 1, 1984
41.821
-4.424
-9.57%
jan 1, 1985
49.029
+7.208
17.24%
jan 1, 1986
55.629
+6.6
13.46%
jan 1, 1987
57.746
+2.116
3.8%
jan 1, 1988
52.855
-4.891
-8.47%
jan 1, 1989
47.314
-5.54
-10.48%
jan 1, 1990
41.46
-5.854
-12.37%
jan 1, 1991
39.714
-1.746
-4.21%
jan 1, 1992
35.941
-3.774
-9.5%
jan 1, 1993
37.866
+1.925
5.36%
jan 1, 1994
40.905
+3.039
8.03%
jan 1, 1995
42.715
+1.81
4.42%
jan 1, 1996
43.398
+0.683
1.6%
jan 1, 1997
40.197
-3.202
-7.38%
jan 1, 1998
40.904
+0.708
1.76%
jan 1, 2000
53.049
+12.144
29.69%
jan 1, 2001
47.949
-5.099
-9.61%
jan 1, 2002
47.024
-0.925
-1.93%
jan 1, 2003
49.249
+2.225
4.73%
jan 1, 2004
44.331
-4.917
-9.98%
jan 1, 2005
38.422
-5.909
-13.33%
jan 1, 2006
39.28
+0.858
2.23%
jan 1, 2007
40.217
+0.937
2.39%
jan 1, 2008
36.0
-4.217
-10.49%
jan 1, 2009
34.398
-1.602
-4.45%
jan 1, 2010
38.688
+4.29
12.47%
jan 1, 2011
33.245
-5.443
-14.07%
jan 1, 2012
36.961
+3.716
11.18%
jan 1, 2013
37.85
+0.89
2.41%
jan 1, 2014
43.468
+5.618
14.84%
jan 1, 2015
43.429
-0.039
-0.09%
jan 1, 2016
50.84
+7.411
17.06%
Ranking of countries by current statistics by years


Comments: