29
/
en
AIzaSyAYiBZKx7MnpbEhh9jyipgxe19OcubqV5w
April 1, 2024
267506
Trinidad and Tobago
TTO
true
2
1
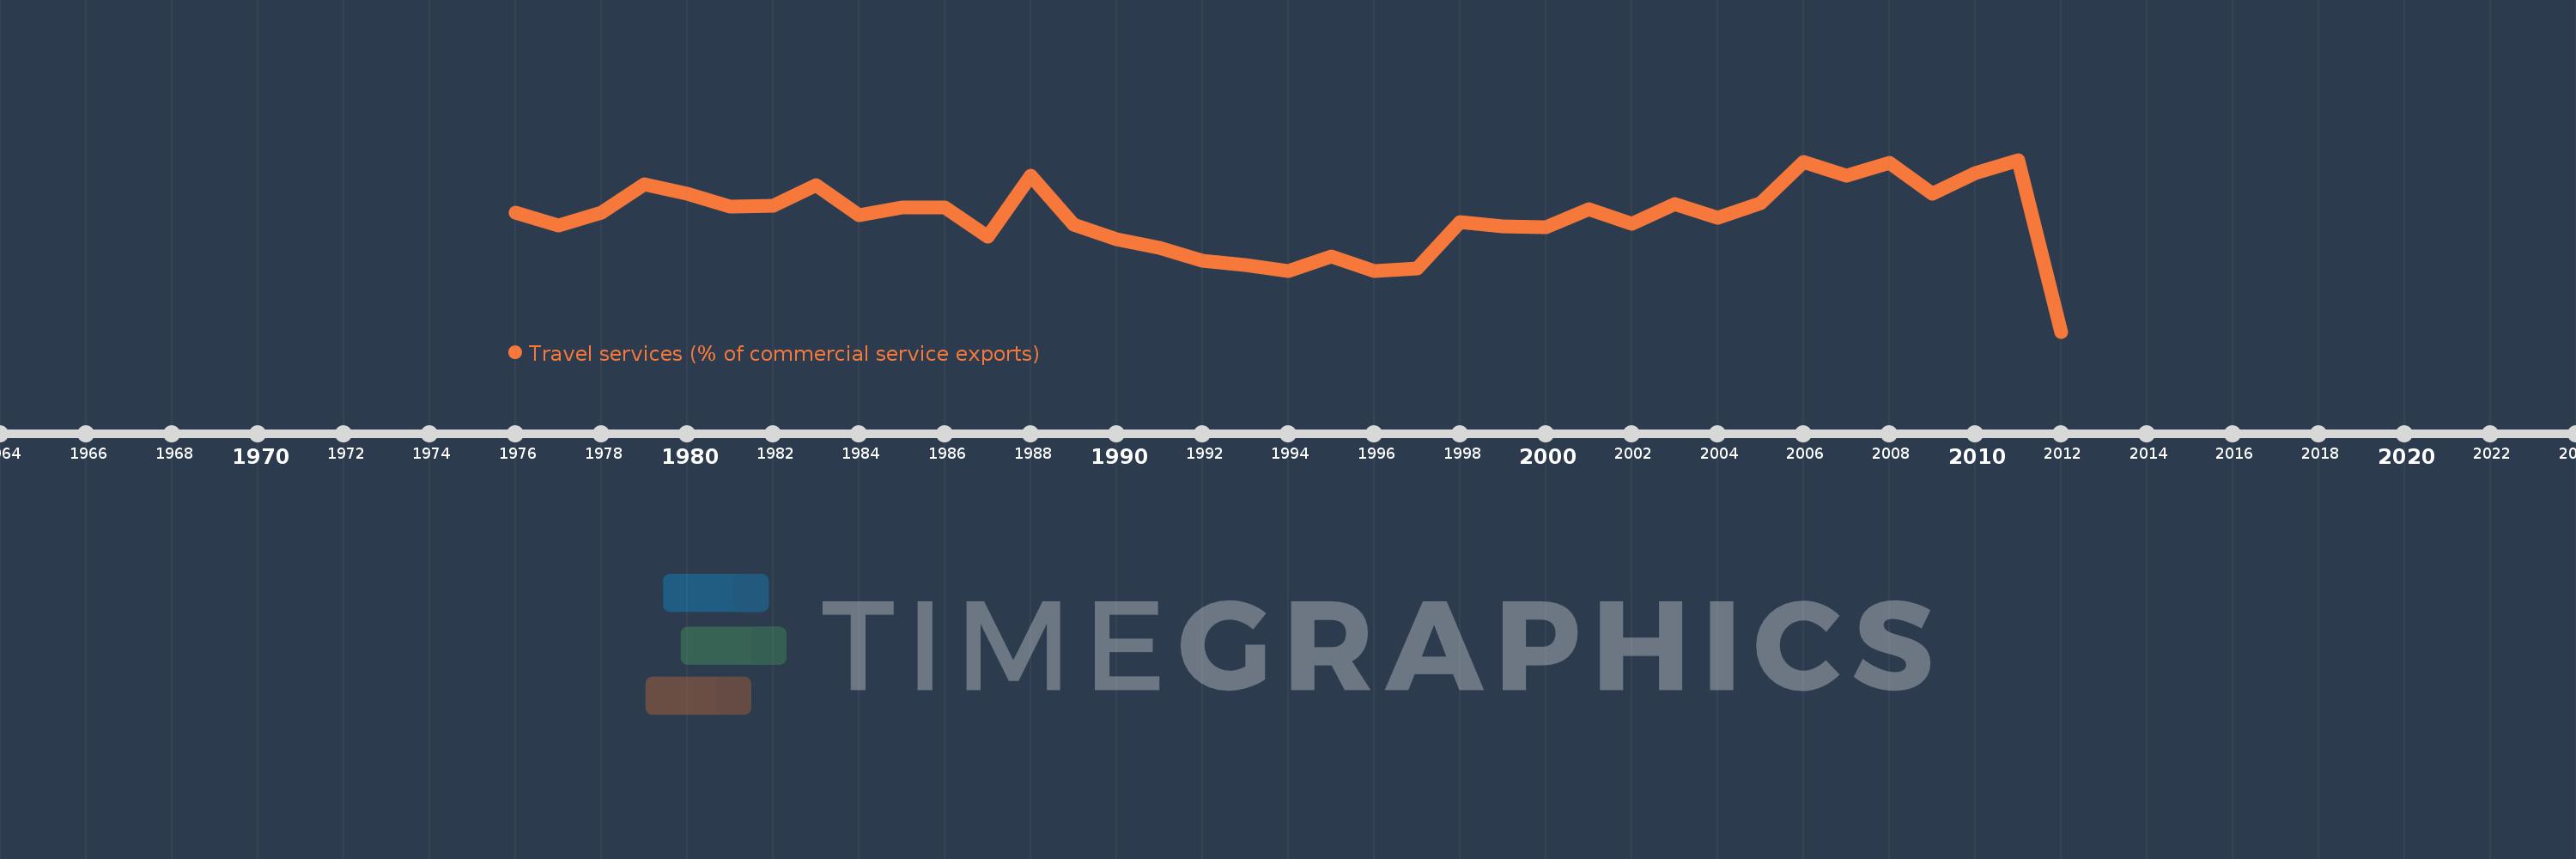
Travel services (% of commercial service exports)
2012,2011,2010,2009,2008,2007,2006,2005,2004,2003,2002,2001,2000,1999,1998,1997,1996,1995,1994,1993,1992,1991,1990,1989,1988,1987,1986,1985,1984,1983,1982,1981,1980,1979,1978,1977,1976
This statistics in other country:
AfghanistanAlbaniaAlgeriaAngolaAntigua and BarbudaArab WorldArgentinaArmeniaArubaAustraliaAustriaAzerbaijanBahamas, TheBahrainBangladeshBarbadosBelarusBelgiumBelizeBeninBermudaBhutanBoliviaBosnia and HerzegovinaBotswanaBrazilBrunei DarussalamBulgariaBurkina FasoBurundiCabo VerdeCambodiaCameroonCanadaCaribbean small statesCentral African RepublicCentral Europe and the BalticsChadChileChinaColombiaComorosCongo, Dem. Rep.Congo, Rep.Costa RicaCote d'IvoireCroatiaCuracaoCyprusCzech RepublicDenmarkDjiboutiDominicaDominican RepublicEarly-demographic dividendEast Asia & PacificEast Asia & Pacific (excluding high income)East Asia & Pacific (IDA & IBRD countries)EcuadorEgypt, Arab Rep.El SalvadorEritreaEstoniaEthiopiaEuro areaEurope & Central AsiaEurope & Central Asia (excluding high income)Europe & Central Asia (IDA & IBRD countries)European UnionFaroe IslandsFijiFinlandFragile and conflict affected situationsFranceFrench PolynesiaGabonGambia, TheGeorgiaGermanyGhanaGreeceGrenadaGuatemalaGuineaGuinea-BissauGuyanaHaitiHeavily indebted poor countries (HIPC)High incomeHondurasHong Kong SAR, ChinaHungaryIBRD onlyIcelandIDA & IBRD totalIDA onlyIDA totalIndiaIndonesiaIran, Islamic Rep.IraqIrelandIsraelItalyJamaicaJapanJordanKazakhstanKenyaKiribatiKorea, Rep.KosovoKuwaitKyrgyz RepublicLao PDRLate-demographic dividendLatin America & Caribbean Latin America & Caribbean (excluding high income)Latin America & the Caribbean (IDA & IBRD countries)LatviaLeast developed countries: UN classificationLebanonLesothoLiberiaLibyaLithuaniaLow & middle incomeLow incomeLower middle incomeLuxembourgMacao SAR, ChinaMacedonia, FYRMadagascarMalawiMalaysiaMaldivesMaliMaltaMarshall IslandsMauritaniaMauritiusMexicoMicronesia, Fed. Sts.Middle East & North Africa (excluding high income)Middle East & North Africa (IDA & IBRD countries)Middle incomeMoldovaMongoliaMontenegroMoroccoMozambiqueMyanmarNamibiaNepalNetherlandsNew CaledoniaNew ZealandNicaraguaNigerNigeriaNorth AmericaNorwayOECD membersOmanOther small statesPacific island small statesPakistanPalauPanamaPapua New GuineaParaguayPeruPhilippinesPolandPortugalPost-demographic dividendPre-demographic dividendQatarRomaniaRussian FederationRwandaSamoaSao Tome and PrincipeSaudi ArabiaSenegalSerbiaSeychellesSierra LeoneSingaporeSint Maarten (Dutch part)Slovak RepublicSloveniaSmall statesSolomon IslandsSouth AfricaSouth AsiaSouth Asia (IDA & IBRD)South SudanSpainSri LankaSt. Kitts and NevisSt. LuciaSt. Vincent and the GrenadinesSub-Saharan Africa Sub-Saharan Africa (excluding high income)Sub-Saharan Africa (IDA & IBRD countries)SudanSurinameSwazilandSwedenSwitzerlandSyrian Arab RepublicTajikistanTanzaniaThailandTimor-LesteTogoTongaTrinidad and TobagoTunisiaTurkeyTuvaluUgandaUkraineUnited KingdomUnited StatesUpper middle incomeUruguayVanuatuVenezuela, RBWest Bank and GazaWorldYemen, Rep.ZambiaZimbabwe Timeline:
This timeline shows a graph from 1976 to 2012 of Trinidad and Tobago. No data until 1975. Number of actual observations by date: 37.
Source name:
World Development Indicators
Source organization:
International Monetary Fund, Balance of Payments Statistics Yearbook and data files.
Categories, topics:
Private Sector, Trade
Last updated:
apr 23, 2017
Indicators value changes by year
At the date of observation
Value
Absolute change
Change from previous value
jan 1, 1976
38.252
+38.252
0.0%
jan 1, 1977
35.149
-3.103
-8.11%
jan 1, 1978
38.296
+3.147
8.95%
jan 1, 1979
45.532
+7.237
18.9%
jan 1, 1980
43.046
-2.486
-5.46%
jan 1, 1981
39.915
-3.131
-7.27%
jan 1, 1982
40.131
+0.216
0.54%
jan 1, 1983
45.304
+5.172
12.89%
jan 1, 1984
37.767
-7.537
-16.64%
jan 1, 1985
39.655
+1.888
5.0%
jan 1, 1986
39.555
-0.1
-0.25%
jan 1, 1987
32.26
-7.294
-18.44%
jan 1, 1988
47.803
+15.542
48.18%
jan 1, 1989
35.345
-12.457
-26.06%
jan 1, 1990
31.603
-3.742
-10.59%
jan 1, 1991
29.425
-2.179
-6.89%
jan 1, 1992
26.084
-3.34
-11.35%
jan 1, 1993
25.032
-1.053
-4.04%
jan 1, 1994
23.58
-1.452
-5.8%
jan 1, 1995
27.261
+3.681
15.61%
jan 1, 1996
23.405
-3.856
-14.14%
jan 1, 1997
24.107
+0.702
3.0%
jan 1, 1998
35.968
+11.86
49.2%
jan 1, 1999
34.954
-1.013
-2.82%
jan 1, 2000
34.633
-0.321
-0.92%
jan 1, 2001
39.175
+4.542
13.11%
jan 1, 2002
35.451
-3.724
-9.51%
jan 1, 2003
40.414
+4.963
14.0%
jan 1, 2004
37.044
-3.37
-8.34%
jan 1, 2005
40.771
+3.727
10.06%
jan 1, 2006
51.308
+10.537
25.84%
jan 1, 2007
47.686
-3.623
-7.06%
jan 1, 2008
50.896
+3.21
6.73%
jan 1, 2009
43.221
-7.675
-15.08%
jan 1, 2010
48.339
+5.117
11.84%
jan 1, 2011
51.75
+3.411
7.06%
jan 1, 2012
8.134
-43.616
-84.28%
Ranking of countries by current statistics by years


Comments: