29
/
en
AIzaSyAYiBZKx7MnpbEhh9jyipgxe19OcubqV5w
April 1, 2024
127034
El Salvador
SLV
true
2
1
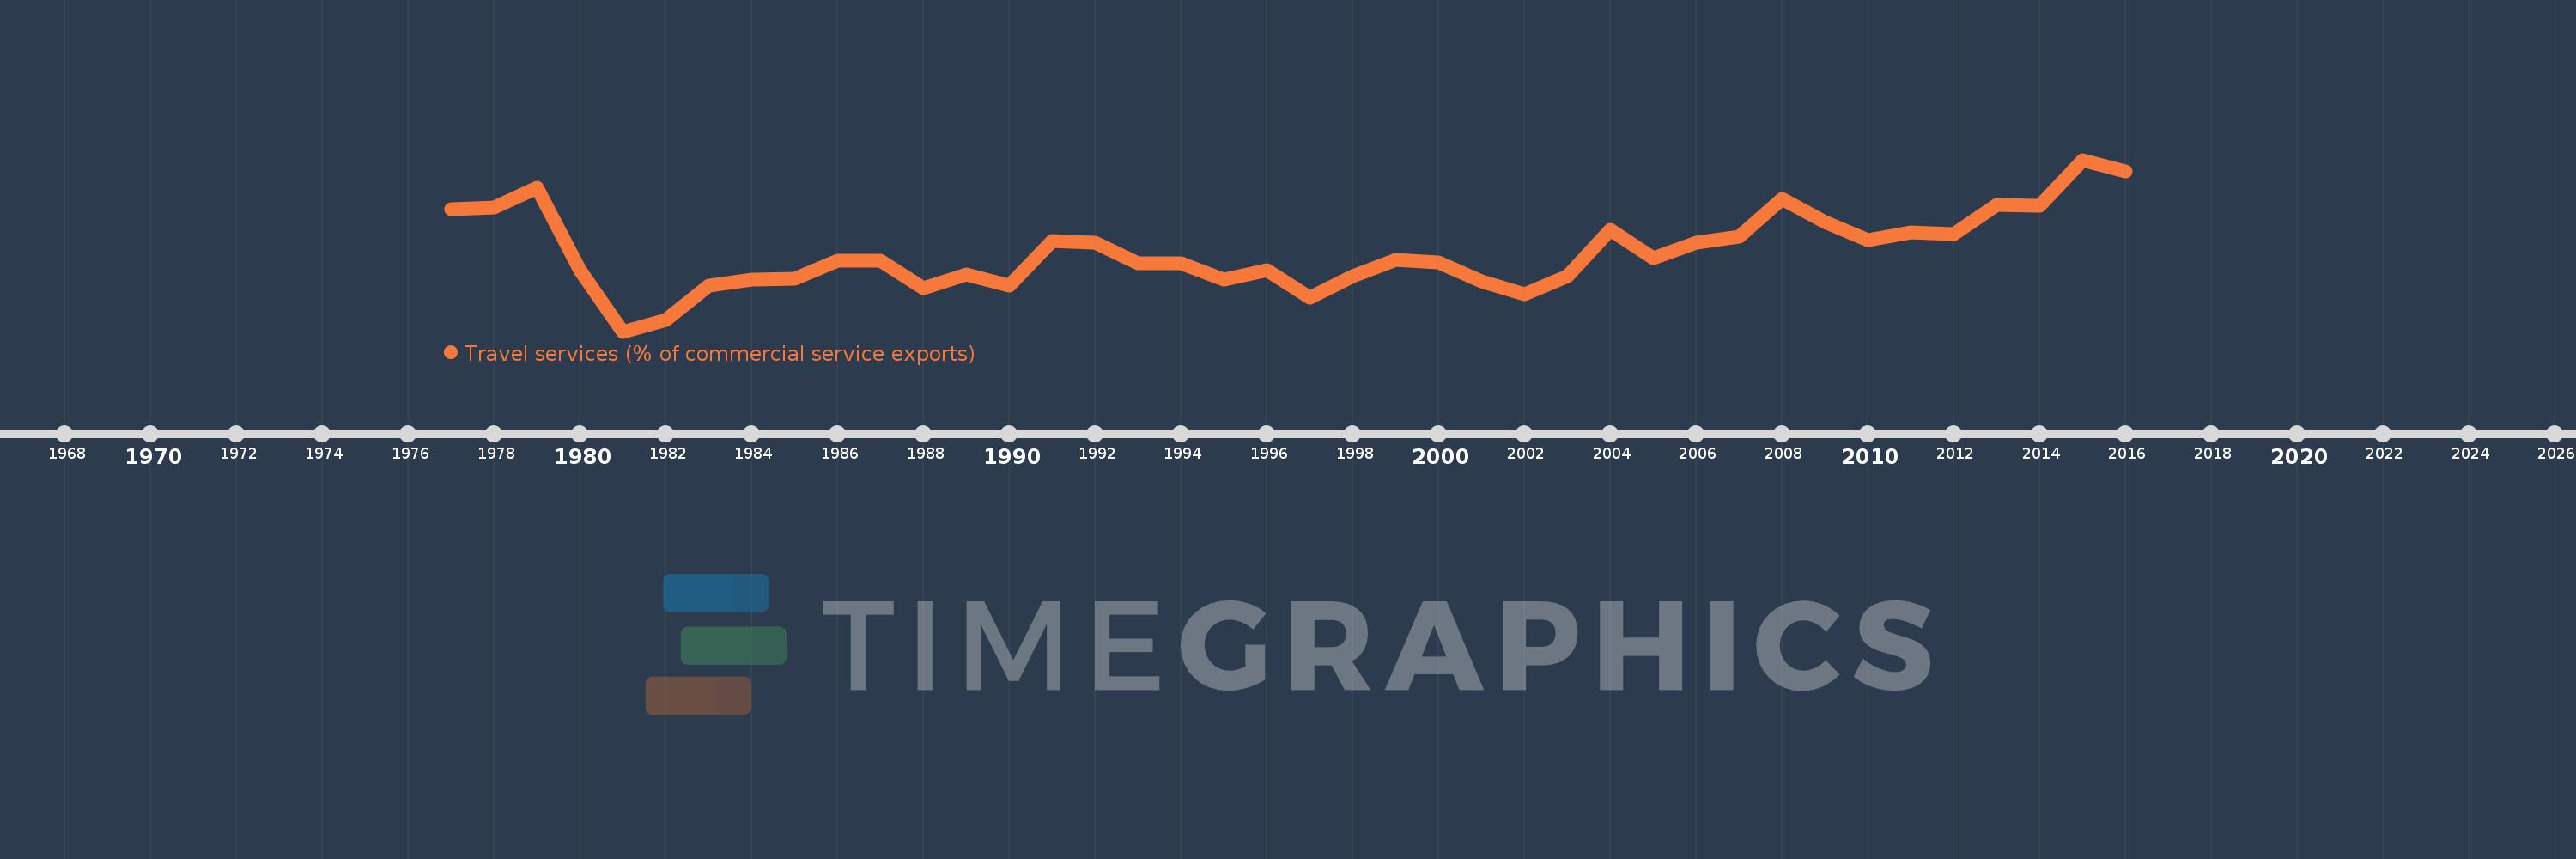
Travel services (% of commercial service exports)
2016,2015,2014,2013,2012,2011,2010,2009,2008,2007,2006,2005,2004,2003,2002,2001,2000,1999,1998,1997,1996,1995,1994,1993,1992,1991,1990,1989,1988,1987,1986,1985,1984,1983,1982,1981,1980,1979,1978,1977
This statistics in other country:
AfghanistanAlbaniaAlgeriaAngolaAntigua and BarbudaArab WorldArgentinaArmeniaArubaAustraliaAustriaAzerbaijanBahamas, TheBahrainBangladeshBarbadosBelarusBelgiumBelizeBeninBermudaBhutanBoliviaBosnia and HerzegovinaBotswanaBrazilBrunei DarussalamBulgariaBurkina FasoBurundiCabo VerdeCambodiaCameroonCanadaCaribbean small statesCentral African RepublicCentral Europe and the BalticsChadChileChinaColombiaComorosCongo, Dem. Rep.Congo, Rep.Costa RicaCote d'IvoireCroatiaCuracaoCyprusCzech RepublicDenmarkDjiboutiDominicaDominican RepublicEarly-demographic dividendEast Asia & PacificEast Asia & Pacific (excluding high income)East Asia & Pacific (IDA & IBRD countries)EcuadorEgypt, Arab Rep.El SalvadorEritreaEstoniaEthiopiaEuro areaEurope & Central AsiaEurope & Central Asia (excluding high income)Europe & Central Asia (IDA & IBRD countries)European UnionFaroe IslandsFijiFinlandFragile and conflict affected situationsFranceFrench PolynesiaGabonGambia, TheGeorgiaGermanyGhanaGreeceGrenadaGuatemalaGuineaGuinea-BissauGuyanaHaitiHeavily indebted poor countries (HIPC)High incomeHondurasHong Kong SAR, ChinaHungaryIBRD onlyIcelandIDA & IBRD totalIDA onlyIDA totalIndiaIndonesiaIran, Islamic Rep.IraqIrelandIsraelItalyJamaicaJapanJordanKazakhstanKenyaKiribatiKorea, Rep.KosovoKuwaitKyrgyz RepublicLao PDRLate-demographic dividendLatin America & Caribbean Latin America & Caribbean (excluding high income)Latin America & the Caribbean (IDA & IBRD countries)LatviaLeast developed countries: UN classificationLebanonLesothoLiberiaLibyaLithuaniaLow & middle incomeLow incomeLower middle incomeLuxembourgMacao SAR, ChinaMacedonia, FYRMadagascarMalawiMalaysiaMaldivesMaliMaltaMarshall IslandsMauritaniaMauritiusMexicoMicronesia, Fed. Sts.Middle East & North Africa (excluding high income)Middle East & North Africa (IDA & IBRD countries)Middle incomeMoldovaMongoliaMontenegroMoroccoMozambiqueMyanmarNamibiaNepalNetherlandsNew CaledoniaNew ZealandNicaraguaNigerNigeriaNorth AmericaNorwayOECD membersOmanOther small statesPacific island small statesPakistanPalauPanamaPapua New GuineaParaguayPeruPhilippinesPolandPortugalPost-demographic dividendPre-demographic dividendQatarRomaniaRussian FederationRwandaSamoaSao Tome and PrincipeSaudi ArabiaSenegalSerbiaSeychellesSierra LeoneSingaporeSint Maarten (Dutch part)Slovak RepublicSloveniaSmall statesSolomon IslandsSouth AfricaSouth AsiaSouth Asia (IDA & IBRD)South SudanSpainSri LankaSt. Kitts and NevisSt. LuciaSt. Vincent and the GrenadinesSub-Saharan Africa Sub-Saharan Africa (excluding high income)Sub-Saharan Africa (IDA & IBRD countries)SudanSurinameSwazilandSwedenSwitzerlandSyrian Arab RepublicTajikistanTanzaniaThailandTimor-LesteTogoTongaTrinidad and TobagoTunisiaTurkeyTuvaluUgandaUkraineUnited KingdomUnited StatesUpper middle incomeUruguayVanuatuVenezuela, RBWest Bank and GazaWorldYemen, Rep.ZambiaZimbabwe Timeline:
This timeline shows a graph from 1977 to 2016 of El Salvador. No data until 1976. Number of actual observations by date: 40.
Source name:
World Development Indicators
Source organization:
International Monetary Fund, Balance of Payments Statistics Yearbook and data files.
Categories, topics:
Private Sector, Trade
Last updated:
apr 23, 2017
Indicators value changes by year
Minimum:
10.954
jan 1, 1981
Maximum:
37.947
jan 1, 2015
At the date of observation
Value
Absolute change
Change from previous value
jan 1, 1977
30.121
+30.121
0.0%
jan 1, 1978
30.413
+0.292
0.97%
jan 1, 1979
33.577
+3.164
10.4%
jan 1, 1980
20.643
-12.934
-38.52%
jan 1, 1981
10.954
-9.688
-46.93%
jan 1, 1982
12.794
+1.84
16.8%
jan 1, 1983
18.235
+5.44
42.52%
jan 1, 1984
19.052
+0.817
4.48%
jan 1, 1985
19.287
+0.235
1.23%
jan 1, 1986
22.143
+2.856
14.81%
jan 1, 1987
22.131
-0.012
-0.05%
jan 1, 1988
17.818
-4.312
-19.49%
jan 1, 1989
19.924
+2.105
11.82%
jan 1, 1990
18.126
-1.798
-9.02%
jan 1, 1991
25.249
+7.122
39.29%
jan 1, 1992
24.951
-0.298
-1.18%
jan 1, 1993
21.75
-3.201
-12.83%
jan 1, 1994
21.724
-0.026
-0.12%
jan 1, 1995
19.138
-2.586
-11.9%
jan 1, 1996
20.544
+1.406
7.35%
jan 1, 1997
16.269
-4.275
-20.81%
jan 1, 1998
19.643
+3.374
20.74%
jan 1, 1999
22.194
+2.551
12.99%
jan 1, 2000
21.779
-0.414
-1.87%
jan 1, 2001
18.882
-2.897
-13.3%
jan 1, 2002
16.838
-2.044
-10.82%
jan 1, 2003
19.676
+2.838
16.85%
jan 1, 2004
26.901
+7.225
36.72%
jan 1, 2005
22.503
-4.398
-16.35%
jan 1, 2006
24.929
+2.425
10.78%
jan 1, 2007
25.826
+0.898
3.6%
jan 1, 2008
31.8
+5.973
23.13%
jan 1, 2009
28.18
-3.619
-11.38%
jan 1, 2010
25.281
-2.899
-10.29%
jan 1, 2011
26.605
+1.324
5.24%
jan 1, 2012
26.286
-0.319
-1.2%
jan 1, 2013
30.909
+4.624
17.59%
jan 1, 2014
30.77
-0.139
-0.45%
jan 1, 2015
37.947
+7.177
23.32%
jan 1, 2016
36.099
-1.847
-4.87%
Ranking of countries by current statistics by years


Comments: