29
/
en
AIzaSyAYiBZKx7MnpbEhh9jyipgxe19OcubqV5w
April 1, 2024
39630
IDA only
IDX
false
2
1
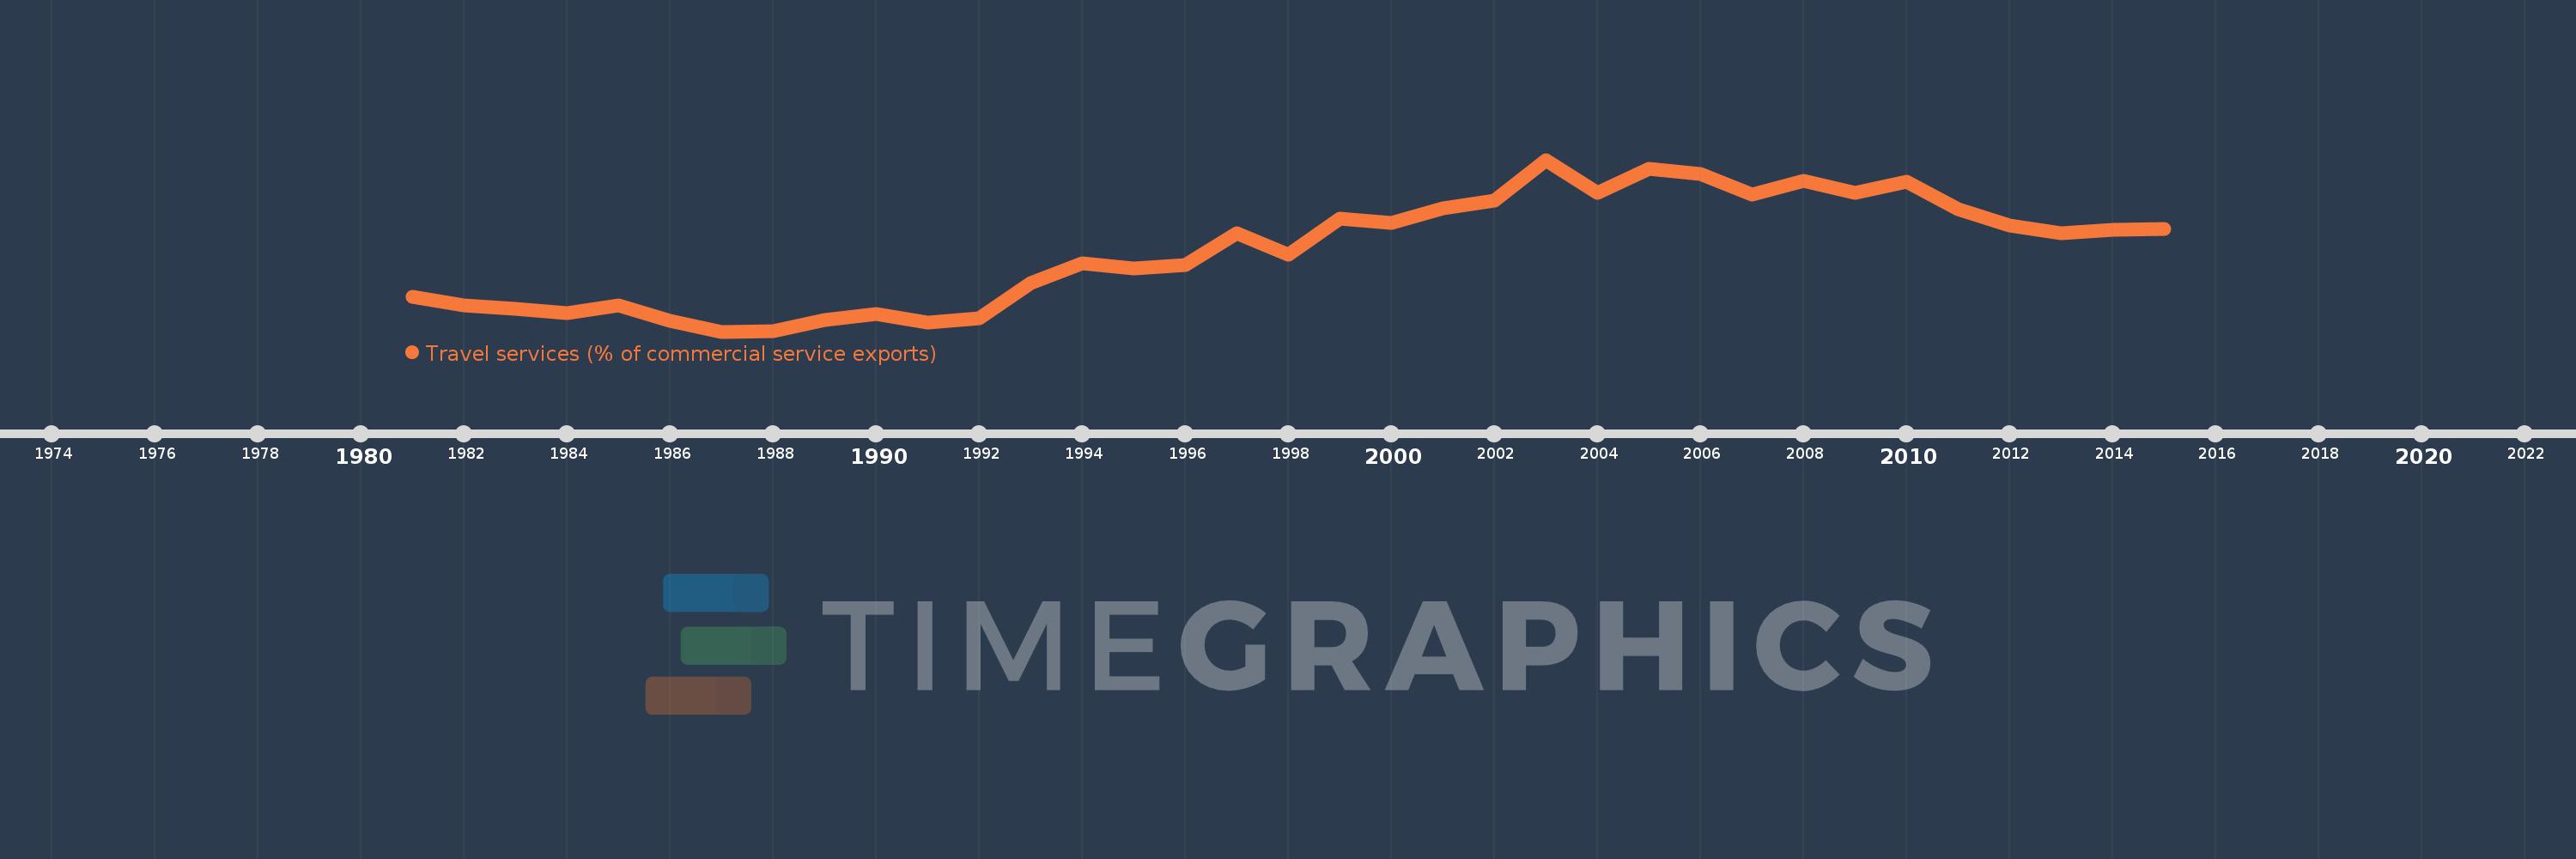
Travel services (% of commercial service exports)
2015,2014,2013,2012,2011,2010,2009,2008,2007,2006,2005,2004,2003,2002,2001,2000,1999,1998,1997,1996,1995,1994,1993,1992,1991,1990,1989,1988,1987,1986,1985,1984,1983,1982,1981
This statistics in other country:
AfghanistanAlbaniaAlgeriaAngolaAntigua and BarbudaArab WorldArgentinaArmeniaArubaAustraliaAustriaAzerbaijanBahamas, TheBahrainBangladeshBarbadosBelarusBelgiumBelizeBeninBermudaBhutanBoliviaBosnia and HerzegovinaBotswanaBrazilBrunei DarussalamBulgariaBurkina FasoBurundiCabo VerdeCambodiaCameroonCanadaCaribbean small statesCentral African RepublicCentral Europe and the BalticsChadChileChinaColombiaComorosCongo, Dem. Rep.Congo, Rep.Costa RicaCote d'IvoireCroatiaCuracaoCyprusCzech RepublicDenmarkDjiboutiDominicaDominican RepublicEarly-demographic dividendEast Asia & PacificEast Asia & Pacific (excluding high income)East Asia & Pacific (IDA & IBRD countries)EcuadorEgypt, Arab Rep.El SalvadorEritreaEstoniaEthiopiaEuro areaEurope & Central AsiaEurope & Central Asia (excluding high income)Europe & Central Asia (IDA & IBRD countries)European UnionFaroe IslandsFijiFinlandFragile and conflict affected situationsFranceFrench PolynesiaGabonGambia, TheGeorgiaGermanyGhanaGreeceGrenadaGuatemalaGuineaGuinea-BissauGuyanaHaitiHeavily indebted poor countries (HIPC)High incomeHondurasHong Kong SAR, ChinaHungaryIBRD onlyIcelandIDA & IBRD totalIDA onlyIDA totalIndiaIndonesiaIran, Islamic Rep.IraqIrelandIsraelItalyJamaicaJapanJordanKazakhstanKenyaKiribatiKorea, Rep.KosovoKuwaitKyrgyz RepublicLao PDRLate-demographic dividendLatin America & Caribbean Latin America & Caribbean (excluding high income)Latin America & the Caribbean (IDA & IBRD countries)LatviaLeast developed countries: UN classificationLebanonLesothoLiberiaLibyaLithuaniaLow & middle incomeLow incomeLower middle incomeLuxembourgMacao SAR, ChinaMacedonia, FYRMadagascarMalawiMalaysiaMaldivesMaliMaltaMarshall IslandsMauritaniaMauritiusMexicoMicronesia, Fed. Sts.Middle East & North Africa (excluding high income)Middle East & North Africa (IDA & IBRD countries)Middle incomeMoldovaMongoliaMontenegroMoroccoMozambiqueMyanmarNamibiaNepalNetherlandsNew CaledoniaNew ZealandNicaraguaNigerNigeriaNorth AmericaNorwayOECD membersOmanOther small statesPacific island small statesPakistanPalauPanamaPapua New GuineaParaguayPeruPhilippinesPolandPortugalPost-demographic dividendPre-demographic dividendQatarRomaniaRussian FederationRwandaSamoaSao Tome and PrincipeSaudi ArabiaSenegalSerbiaSeychellesSierra LeoneSingaporeSint Maarten (Dutch part)Slovak RepublicSloveniaSmall statesSolomon IslandsSouth AfricaSouth AsiaSouth Asia (IDA & IBRD)South SudanSpainSri LankaSt. Kitts and NevisSt. LuciaSt. Vincent and the GrenadinesSub-Saharan Africa Sub-Saharan Africa (excluding high income)Sub-Saharan Africa (IDA & IBRD countries)SudanSurinameSwazilandSwedenSwitzerlandSyrian Arab RepublicTajikistanTanzaniaThailandTimor-LesteTogoTongaTrinidad and TobagoTunisiaTurkeyTuvaluUgandaUkraineUnited KingdomUnited StatesUpper middle incomeUruguayVanuatuVenezuela, RBWest Bank and GazaWorldYemen, Rep.ZambiaZimbabwe Timeline:
This timeline shows a graph from 1981 to 2015 of IDA only. No data until 1980. Number of actual observations by date: 35.
Source name:
World Development Indicators
Source organization:
International Monetary Fund, Balance of Payments Statistics Yearbook and data files.
Categories, topics:
Private Sector, Trade
Last updated:
apr 23, 2017
Indicators value changes by year
Minimum:
25.325
jan 1, 1987
At the date of observation
Value
Absolute change
Change from previous value
jan 1, 1981
30.154
+30.154
0.0%
jan 1, 1982
29.032
-1.121
-3.72%
jan 1, 1983
28.48
-0.552
-1.9%
jan 1, 1984
27.971
-0.509
-1.79%
jan 1, 1985
28.945
+0.973
3.48%
jan 1, 1986
26.855
-2.089
-7.22%
jan 1, 1987
25.325
-1.53
-5.7%
jan 1, 1988
25.368
+0.043
0.17%
jan 1, 1989
26.938
+1.569
6.19%
jan 1, 1990
27.785
+0.847
3.15%
jan 1, 1991
26.626
-1.159
-4.17%
jan 1, 1992
27.161
+0.535
2.01%
jan 1, 1993
32.185
+5.024
18.5%
jan 1, 1994
34.871
+2.686
8.34%
jan 1, 1995
34.163
-0.707
-2.03%
jan 1, 1996
34.615
+0.452
1.32%
jan 1, 1997
39.158
+4.543
13.12%
jan 1, 1998
36.111
-3.047
-7.78%
jan 1, 1999
41.115
+5.004
13.86%
jan 1, 2000
40.572
-0.543
-1.32%
jan 1, 2001
42.596
+2.024
4.99%
jan 1, 2002
43.695
+1.099
2.58%
jan 1, 2003
49.41
+5.715
13.08%
jan 1, 2004
44.758
-4.652
-9.41%
jan 1, 2005
48.116
+3.358
7.5%
jan 1, 2006
47.48
-0.636
-1.32%
jan 1, 2007
44.531
-2.949
-6.21%
jan 1, 2008
46.505
+1.975
4.43%
jan 1, 2009
44.735
-1.77
-3.81%
jan 1, 2010
46.309
+1.574
3.52%
jan 1, 2011
42.525
-3.784
-8.17%
jan 1, 2012
40.141
-2.384
-5.61%
jan 1, 2013
39.077
-1.065
-2.65%
jan 1, 2014
39.601
+0.524
1.34%
jan 1, 2015
39.726
+0.125
0.32%
Ranking of countries by current statistics by years


Comments: