29
/
en
AIzaSyAYiBZKx7MnpbEhh9jyipgxe19OcubqV5w
April 1, 2024
47821
Lower middle income
LMC
false
2
1
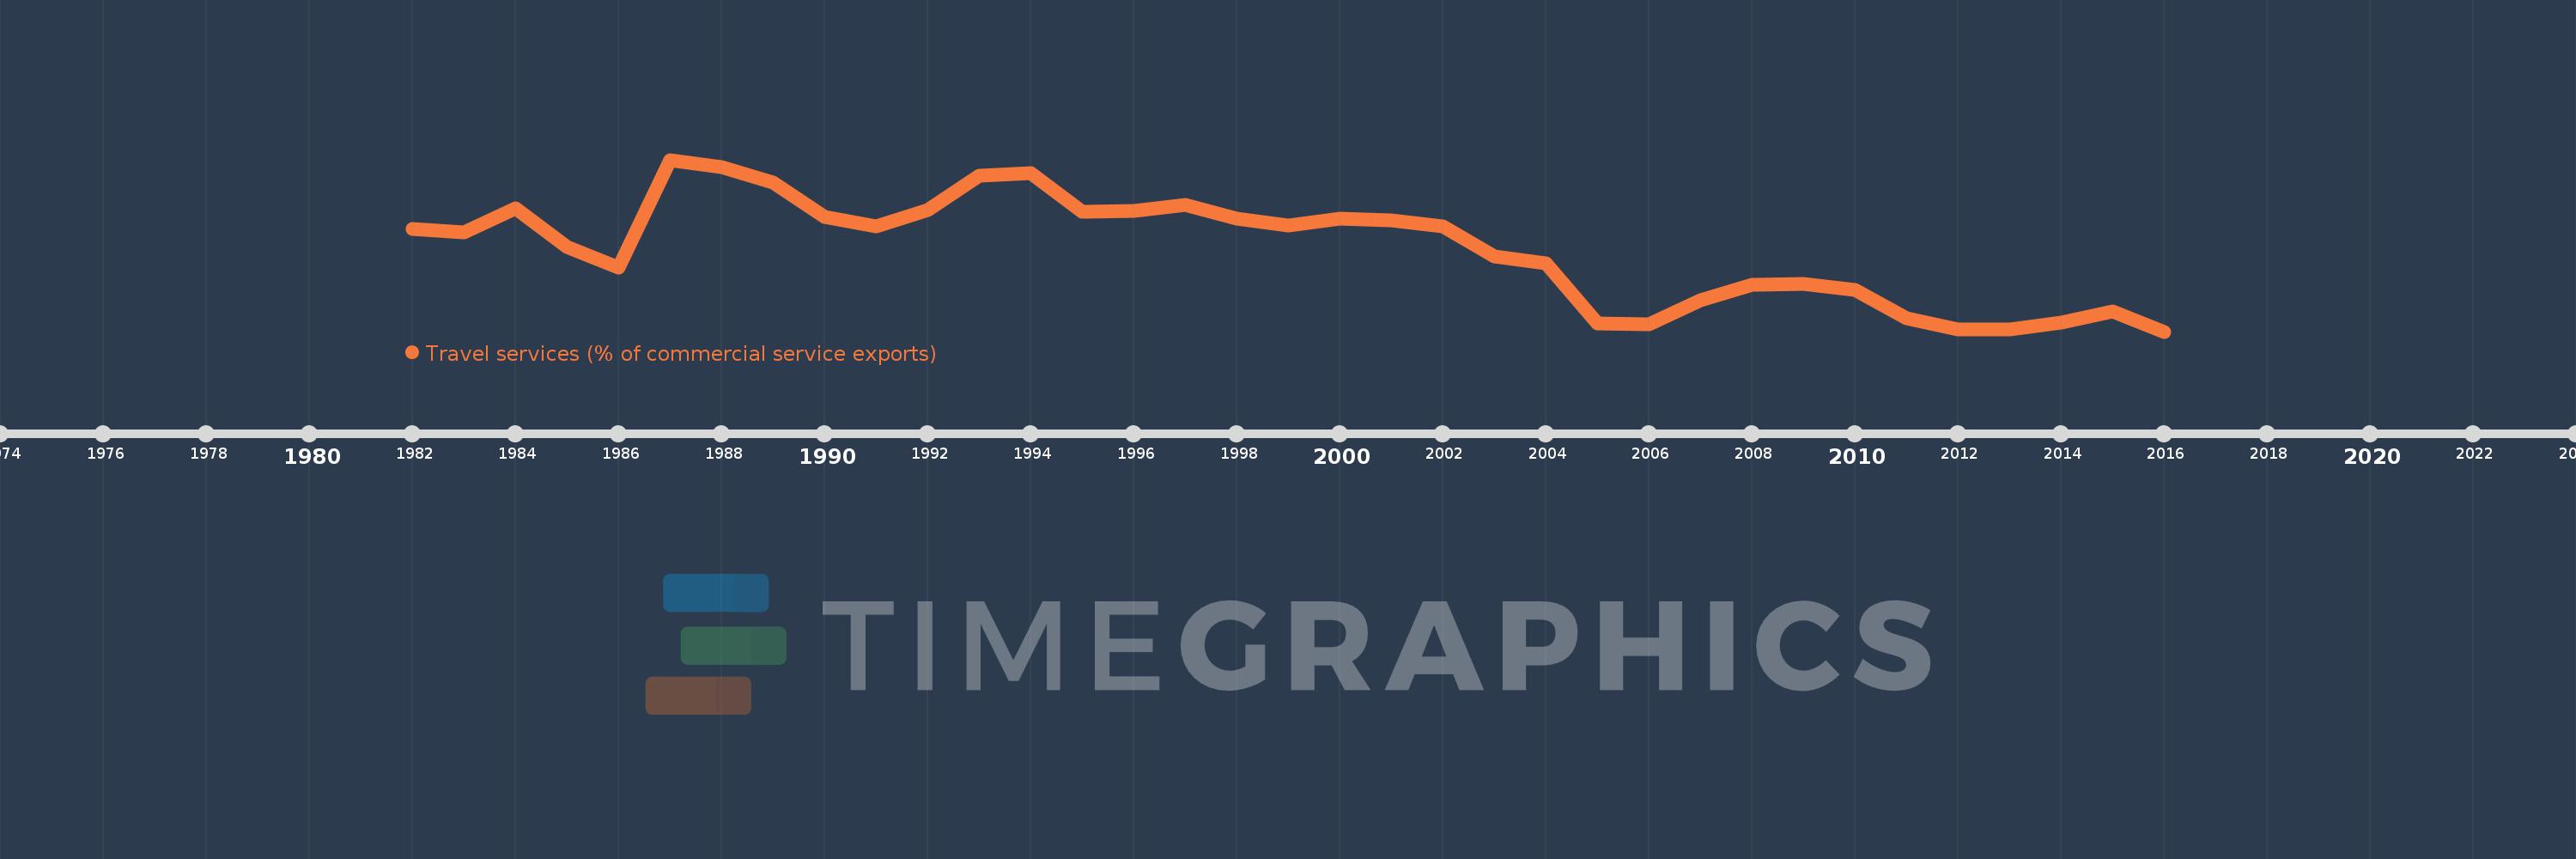
Travel services (% of commercial service exports)
2016,2015,2014,2013,2012,2011,2010,2009,2008,2007,2006,2005,2004,2003,2002,2001,2000,1999,1998,1997,1996,1995,1994,1993,1992,1991,1990,1989,1988,1987,1986,1985,1984,1983,1982
This statistics in other country:
AfghanistanAlbaniaAlgeriaAngolaAntigua and BarbudaArab WorldArgentinaArmeniaArubaAustraliaAustriaAzerbaijanBahamas, TheBahrainBangladeshBarbadosBelarusBelgiumBelizeBeninBermudaBhutanBoliviaBosnia and HerzegovinaBotswanaBrazilBrunei DarussalamBulgariaBurkina FasoBurundiCabo VerdeCambodiaCameroonCanadaCaribbean small statesCentral African RepublicCentral Europe and the BalticsChadChileChinaColombiaComorosCongo, Dem. Rep.Congo, Rep.Costa RicaCote d'IvoireCroatiaCuracaoCyprusCzech RepublicDenmarkDjiboutiDominicaDominican RepublicEarly-demographic dividendEast Asia & PacificEast Asia & Pacific (excluding high income)East Asia & Pacific (IDA & IBRD countries)EcuadorEgypt, Arab Rep.El SalvadorEritreaEstoniaEthiopiaEuro areaEurope & Central AsiaEurope & Central Asia (excluding high income)Europe & Central Asia (IDA & IBRD countries)European UnionFaroe IslandsFijiFinlandFragile and conflict affected situationsFranceFrench PolynesiaGabonGambia, TheGeorgiaGermanyGhanaGreeceGrenadaGuatemalaGuineaGuinea-BissauGuyanaHaitiHeavily indebted poor countries (HIPC)High incomeHondurasHong Kong SAR, ChinaHungaryIBRD onlyIcelandIDA & IBRD totalIDA onlyIDA totalIndiaIndonesiaIran, Islamic Rep.IraqIrelandIsraelItalyJamaicaJapanJordanKazakhstanKenyaKiribatiKorea, Rep.KosovoKuwaitKyrgyz RepublicLao PDRLate-demographic dividendLatin America & Caribbean Latin America & Caribbean (excluding high income)Latin America & the Caribbean (IDA & IBRD countries)LatviaLeast developed countries: UN classificationLebanonLesothoLiberiaLibyaLithuaniaLow & middle incomeLow incomeLower middle incomeLuxembourgMacao SAR, ChinaMacedonia, FYRMadagascarMalawiMalaysiaMaldivesMaliMaltaMarshall IslandsMauritaniaMauritiusMexicoMicronesia, Fed. Sts.Middle East & North Africa (excluding high income)Middle East & North Africa (IDA & IBRD countries)Middle incomeMoldovaMongoliaMontenegroMoroccoMozambiqueMyanmarNamibiaNepalNetherlandsNew CaledoniaNew ZealandNicaraguaNigerNigeriaNorth AmericaNorwayOECD membersOmanOther small statesPacific island small statesPakistanPalauPanamaPapua New GuineaParaguayPeruPhilippinesPolandPortugalPost-demographic dividendPre-demographic dividendQatarRomaniaRussian FederationRwandaSamoaSao Tome and PrincipeSaudi ArabiaSenegalSerbiaSeychellesSierra LeoneSingaporeSint Maarten (Dutch part)Slovak RepublicSloveniaSmall statesSolomon IslandsSouth AfricaSouth AsiaSouth Asia (IDA & IBRD)South SudanSpainSri LankaSt. Kitts and NevisSt. LuciaSt. Vincent and the GrenadinesSub-Saharan Africa Sub-Saharan Africa (excluding high income)Sub-Saharan Africa (IDA & IBRD countries)SudanSurinameSwazilandSwedenSwitzerlandSyrian Arab RepublicTajikistanTanzaniaThailandTimor-LesteTogoTongaTrinidad and TobagoTunisiaTurkeyTuvaluUgandaUkraineUnited KingdomUnited StatesUpper middle incomeUruguayVanuatuVenezuela, RBWest Bank and GazaWorldYemen, Rep.ZambiaZimbabwe Timeline:
This timeline shows a graph from 1982 to 2016 of Lower middle income. No data until 1981. Number of actual observations by date: 35.
Source name:
World Development Indicators
Source organization:
International Monetary Fund, Balance of Payments Statistics Yearbook and data files.
Categories, topics:
Private Sector, Trade
Last updated:
apr 23, 2017
Indicators value changes by year
Minimum:
26.913
jan 1, 2016
Maximum:
46.389
jan 1, 1987
At the date of observation
Value
Absolute change
Change from previous value
jan 1, 1982
38.538
+38.538
0.0%
jan 1, 1983
38.197
-0.341
-0.89%
jan 1, 1984
40.855
+2.658
6.96%
jan 1, 1985
36.457
-4.399
-10.77%
jan 1, 1986
34.15
-2.307
-6.33%
jan 1, 1987
46.389
+12.239
35.84%
jan 1, 1988
45.609
-0.78
-1.68%
jan 1, 1989
43.796
-1.814
-3.98%
jan 1, 1990
39.92
-3.876
-8.85%
jan 1, 1991
38.877
-1.043
-2.61%
jan 1, 1992
40.722
+1.845
4.75%
jan 1, 1993
44.622
+3.9
9.58%
jan 1, 1994
44.89
+0.268
0.6%
jan 1, 1995
40.483
-4.407
-9.82%
jan 1, 1996
40.613
+0.13
0.32%
jan 1, 1997
41.256
+0.643
1.58%
jan 1, 1998
39.765
-1.491
-3.61%
jan 1, 1999
38.953
-0.811
-2.04%
jan 1, 2000
39.741
+0.787
2.02%
jan 1, 2001
39.531
-0.21
-0.53%
jan 1, 2002
38.846
-0.685
-1.73%
jan 1, 2003
35.434
-3.412
-8.78%
jan 1, 2004
34.668
-0.766
-2.16%
jan 1, 2005
27.87
-6.798
-19.61%
jan 1, 2006
27.724
-0.146
-0.53%
jan 1, 2007
30.442
+2.718
9.8%
jan 1, 2008
32.236
+1.794
5.89%
jan 1, 2009
32.366
+0.129
0.4%
jan 1, 2010
31.632
-0.734
-2.27%
jan 1, 2011
28.382
-3.25
-10.28%
jan 1, 2012
27.124
-1.257
-4.43%
jan 1, 2013
27.122
-0.003
-0.01%
jan 1, 2014
27.89
+0.768
2.83%
jan 1, 2015
29.17
+1.28
4.59%
jan 1, 2016
26.913
-2.258
-7.74%
Ranking of countries by current statistics by years


Comments: