29
/
en
AIzaSyAYiBZKx7MnpbEhh9jyipgxe19OcubqV5w
April 1, 2024
75331
Azerbaijan
AZE
true
2
1
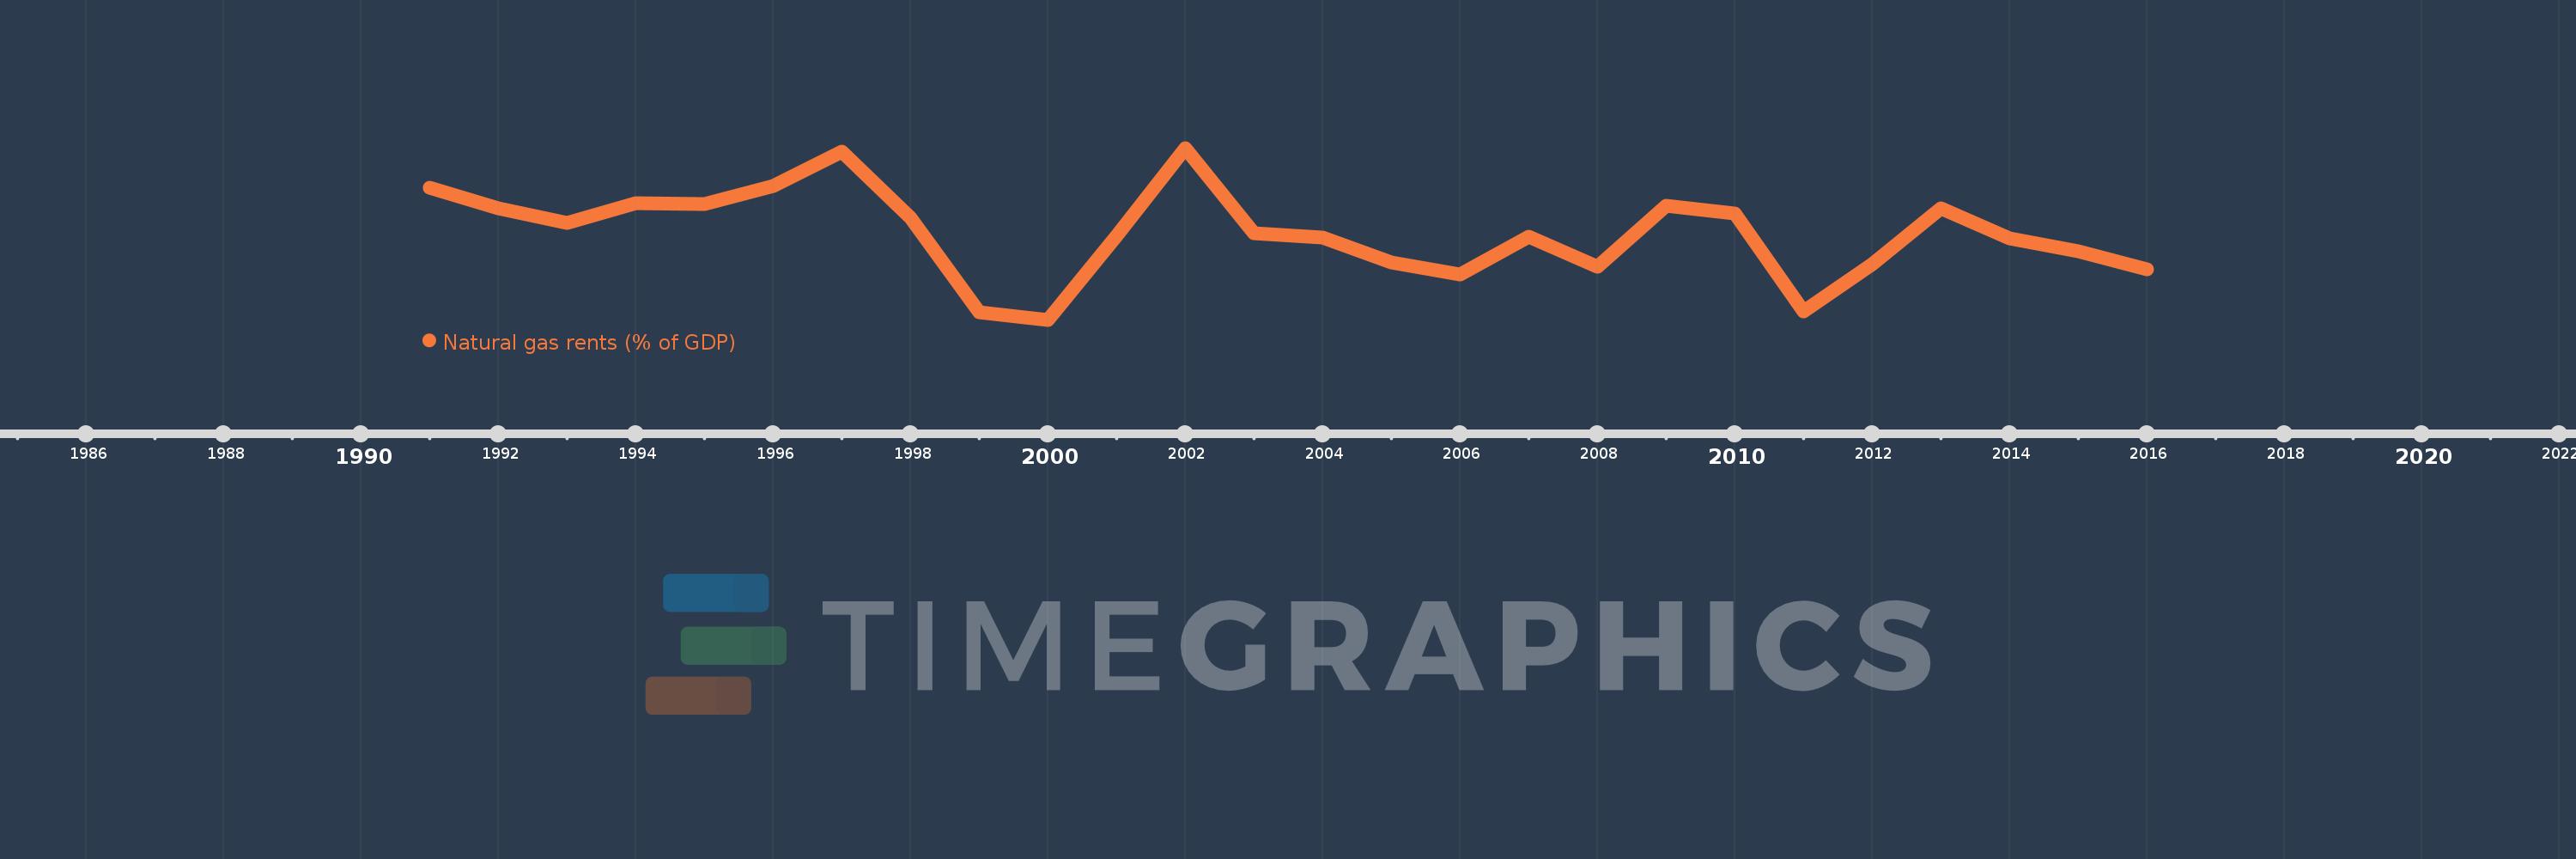
Natural gas rents (% of GDP)
2016,2015,2014,2013,2012,2011,2010,2009,2008,2007,2006,2005,2004,2003,2002,2001,2000,1999,1998,1997,1996,1995,1994,1993,1992,1991
This statistics in other country:
Timeline:
This timeline shows a graph from 1991 to 2016 of Azerbaijan. No data until 1990. Number of actual observations by date: 26.
Source name:
World Development Indicators
Source organization:
Estimates based on sources and methods described in "The Changing Wealth of Nations: Measuring Sustainable Development in the New Millennium" (World Bank, 2011).
Categories, topics:
Energy & Mining, Environment
Last updated:
apr 23, 2017
Indicators value changes by year
At the date of observation
Value
Absolute change
Change from previous value
jan 1, 1991
3.875
+3.875
0.0%
jan 1, 1992
3.453
-0.422
-10.88%
jan 1, 1993
3.146
-0.307
-8.88%
jan 1, 1994
3.55
+0.404
12.84%
jan 1, 1995
3.532
-0.018
-0.51%
jan 1, 1996
3.912
+0.38
10.76%
jan 1, 1997
4.605
+0.693
17.72%
jan 1, 1998
3.256
-1.349
-29.3%
jan 1, 1999
1.336
-1.92
-58.97%
jan 1, 2000
1.175
-0.161
-12.06%
jan 1, 2001
2.885
+1.71
145.54%
jan 1, 2002
4.685
+1.801
62.42%
jan 1, 2003
2.936
-1.749
-37.33%
jan 1, 2004
2.859
-0.077
-2.63%
jan 1, 2005
2.344
-0.515
-18.02%
jan 1, 2006
2.106
-0.238
-10.17%
jan 1, 2007
2.87
+0.764
36.3%
jan 1, 2008
2.255
-0.615
-21.43%
jan 1, 2009
3.499
+1.244
55.17%
jan 1, 2010
3.338
-0.162
-4.62%
jan 1, 2011
1.342
-1.995
-59.78%
jan 1, 2012
2.308
+0.965
71.9%
jan 1, 2013
3.453
+1.145
49.63%
jan 1, 2014
2.838
-0.615
-17.81%
jan 1, 2015
2.565
-0.273
-9.63%
jan 1, 2016
2.207
-0.358
-13.96%
Ranking of countries by current statistics by years


Comments: