29
/
en
AIzaSyAYiBZKx7MnpbEhh9jyipgxe19OcubqV5w
April 1, 2024
258622
Syrian Arab Republic
SYR
true
2
1
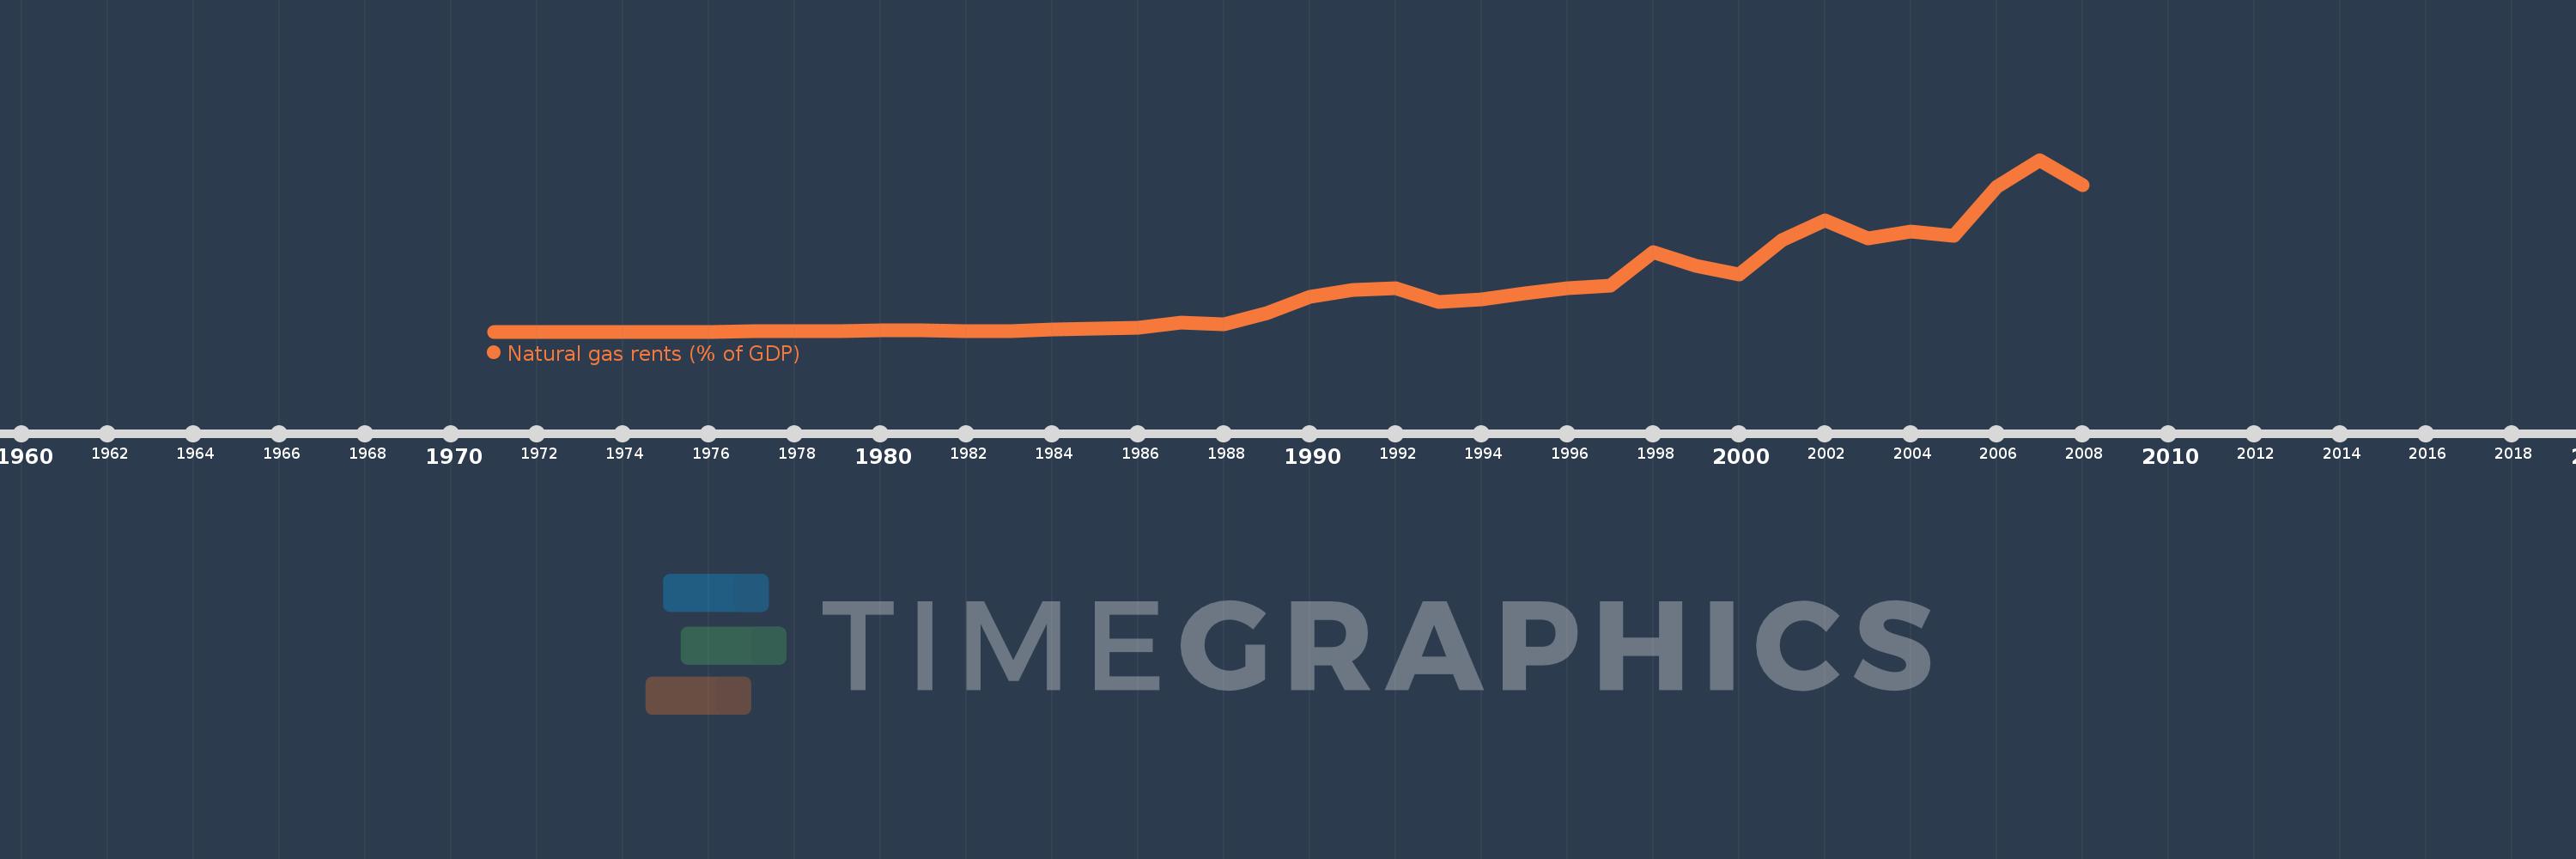
Natural gas rents (% of GDP)
2008,2007,2006,2005,2004,2003,2002,2001,2000,1999,1998,1997,1996,1995,1994,1993,1992,1991,1990,1989,1988,1987,1986,1985,1984,1983,1982,1981,1980,1979,1978,1977,1976,1975,1974,1973,1972,1971
This statistics in other country:
Timeline:
This timeline shows a graph from 1971 to 2008 of Syrian Arab Republic. No data until 1970. Number of actual observations by date: 38.
Source name:
World Development Indicators
Source organization:
Estimates based on sources and methods described in "The Changing Wealth of Nations: Measuring Sustainable Development in the New Millennium" (World Bank, 2011).
Categories, topics:
Energy & Mining, Environment
Last updated:
apr 23, 2017
Indicators value changes by year
At the date of observation
Value
Absolute change
Change from previous value
jan 1, 1977
0.003
+0.003
%
jan 1, 1978
0.004
+0.001
21.54%
jan 1, 1979
0.004
-0.001
-12.88%
jan 1, 1980
0.007
+0.004
104.65%
jan 1, 1981
0.008
+0.001
16.35%
jan 1, 1982
0.004
-0.004
-46.39%
jan 1, 1983
0.003
-0.001
-32.26%
jan 1, 1984
0.01
+0.007
228.3%
jan 1, 1985
0.015
+0.005
46.29%
jan 1, 1986
0.02
+0.006
38.03%
jan 1, 1987
0.044
+0.024
120.8%
jan 1, 1988
0.035
-0.009
-21.05%
jan 1, 1989
0.085
+0.05
142.19%
jan 1, 1990
0.162
+0.077
90.37%
jan 1, 1991
0.193
+0.031
19.41%
jan 1, 1992
0.201
+0.008
4.28%
jan 1, 1993
0.139
-0.062
-30.86%
jan 1, 1994
0.15
+0.011
7.63%
jan 1, 1995
0.177
+0.027
18.27%
jan 1, 1996
0.202
+0.025
14.05%
jan 1, 1997
0.213
+0.011
5.23%
jan 1, 1998
0.369
+0.156
73.27%
jan 1, 1999
0.308
-0.061
-16.55%
jan 1, 2000
0.268
-0.04
-12.86%
jan 1, 2001
0.426
+0.158
58.91%
jan 1, 2002
0.517
+0.091
21.35%
jan 1, 2003
0.433
-0.084
-16.19%
jan 1, 2004
0.466
+0.033
7.67%
jan 1, 2005
0.445
-0.022
-4.66%
jan 1, 2006
0.674
+0.229
51.55%
jan 1, 2007
0.801
+0.127
18.91%
jan 1, 2008
0.681
-0.12
-14.96%
Ranking of countries by current statistics by years


Comments: