29
/
en
AIzaSyAYiBZKx7MnpbEhh9jyipgxe19OcubqV5w
April 1, 2024
106282
China
CHN
true
2
1
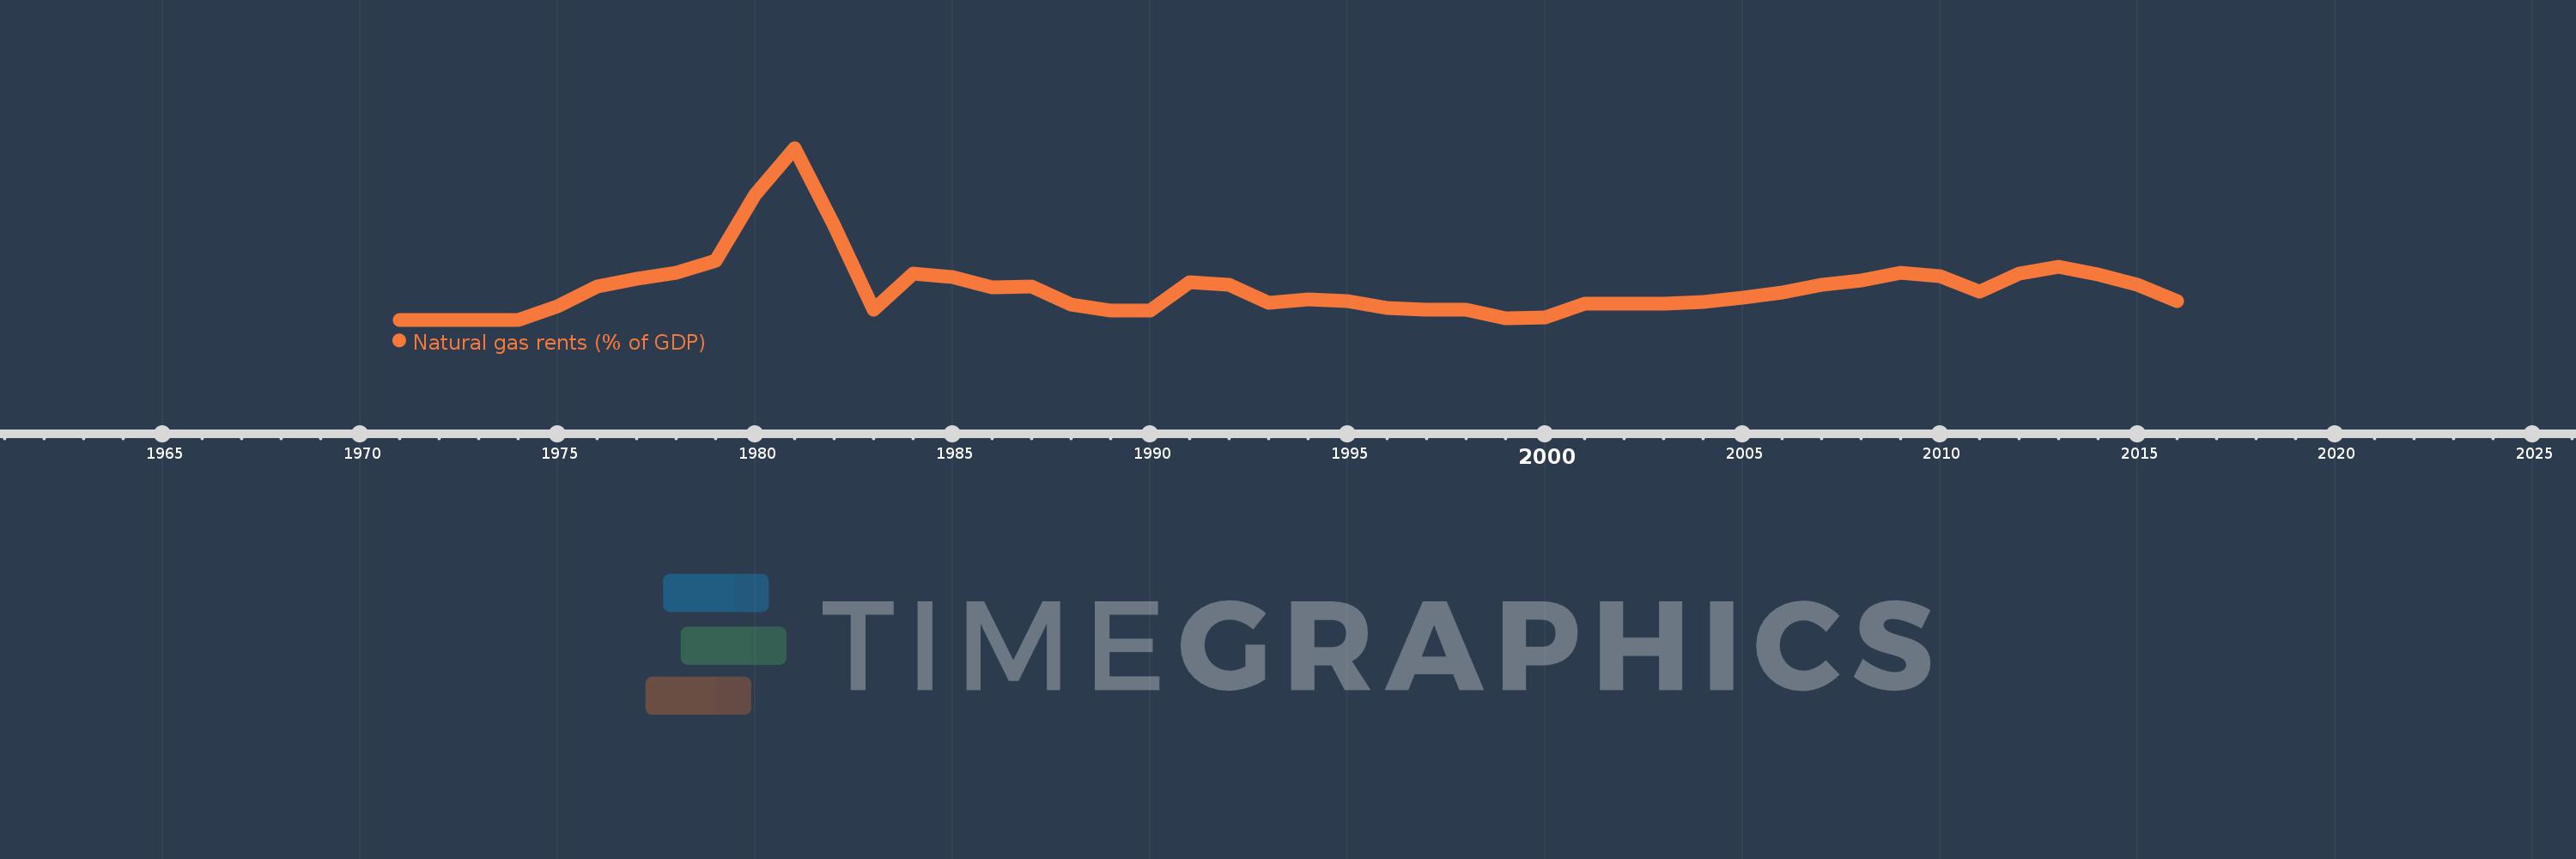
Natural gas rents (% of GDP)
2016,2015,2014,2013,2012,2011,2010,2009,2008,2007,2006,2005,2004,2003,2002,2001,2000,1999,1998,1997,1996,1995,1994,1993,1992,1991,1990,1989,1988,1987,1986,1985,1984,1983,1982,1981,1980,1979,1978,1977,1976,1975,1974,1973,1972,1971
This statistics in other country:
Timeline:
This timeline shows a graph from 1971 to 2016 of China. No data until 1970. Number of actual observations by date: 46.
Source name:
World Development Indicators
Source organization:
Estimates based on sources and methods described in "The Changing Wealth of Nations: Measuring Sustainable Development in the New Millennium" (World Bank, 2011).
Categories, topics:
Energy & Mining, Environment
Last updated:
apr 23, 2017
Indicators value changes by year
At the date of observation
Value
Absolute change
Change from previous value
jan 1, 1974
0.0
0.0
-100.0%
jan 1, 1975
0.025
+0.025
%
jan 1, 1976
0.061
+0.036
143.94%
jan 1, 1977
0.075
+0.015
24.54%
jan 1, 1978
0.086
+0.011
14.42%
jan 1, 1979
0.107
+0.021
24.43%
jan 1, 1980
0.228
+0.12
112.07%
jan 1, 1981
0.313
+0.085
37.42%
jan 1, 1982
0.171
-0.142
-45.48%
jan 1, 1983
0.019
-0.151
-88.72%
jan 1, 1984
0.084
+0.065
337.75%
jan 1, 1985
0.077
-0.008
-8.96%
jan 1, 1986
0.059
-0.018
-22.84%
jan 1, 1987
0.06
+0.001
1.44%
jan 1, 1988
0.028
-0.032
-52.66%
jan 1, 1989
0.017
-0.011
-38.6%
jan 1, 1990
0.016
-0.001
-6.16%
jan 1, 1991
0.069
+0.052
318.18%
jan 1, 1992
0.063
-0.005
-7.68%
jan 1, 1993
0.031
-0.032
-50.73%
jan 1, 1994
0.037
+0.006
18.95%
jan 1, 1995
0.034
-0.003
-7.82%
jan 1, 1996
0.021
-0.013
-38.35%
jan 1, 1997
0.019
-0.002
-11.68%
jan 1, 1998
0.018
0.0
-2.11%
jan 1, 1999
0.002
-0.016
-87.86%
jan 1, 2000
0.005
+0.003
128.37%
jan 1, 2001
0.029
+0.024
465.64%
jan 1, 2002
0.03
+0.002
6.58%
jan 1, 2003
0.029
-0.001
-3.44%
jan 1, 2004
0.032
+0.003
9.11%
jan 1, 2005
0.041
+0.009
27.27%
jan 1, 2006
0.05
+0.009
21.26%
jan 1, 2007
0.064
+0.015
29.82%
jan 1, 2008
0.072
+0.007
11.6%
jan 1, 2009
0.085
+0.013
18.64%
jan 1, 2010
0.079
-0.006
-7.35%
jan 1, 2011
0.051
-0.028
-35.23%
jan 1, 2012
0.084
+0.033
64.48%
jan 1, 2013
0.097
+0.013
15.12%
jan 1, 2014
0.082
-0.014
-14.84%
jan 1, 2015
0.064
-0.019
-22.58%
jan 1, 2016
0.034
-0.03
-46.58%
Ranking of countries by current statistics by years


Comments: