29
/
en
AIzaSyAYiBZKx7MnpbEhh9jyipgxe19OcubqV5w
April 1, 2024
123824
Ecuador
ECU
true
2
1
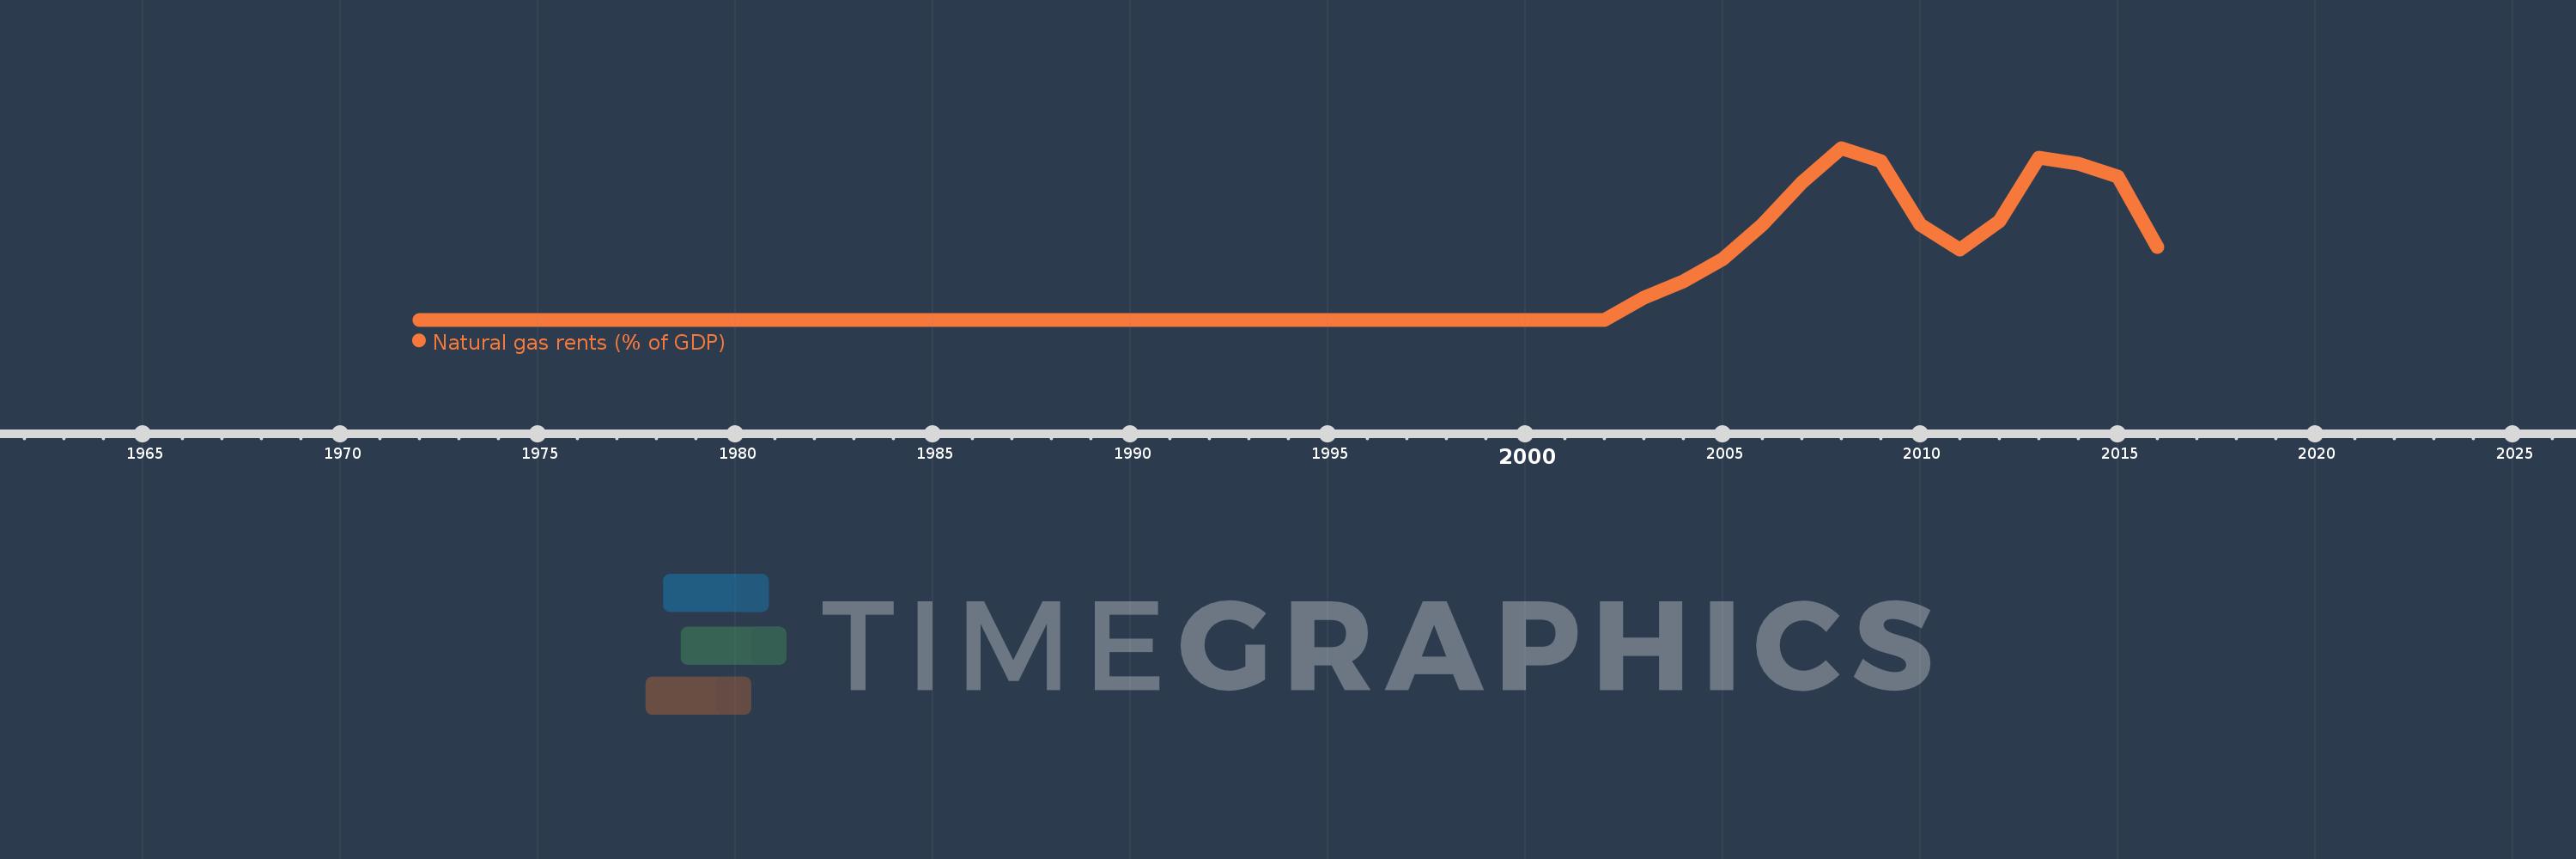
Natural gas rents (% of GDP)
2016,2015,2014,2013,2012,2011,2010,2009,2008,2007,2006,2005,2004,2003,2002,2001,2000,1999,1998,1997,1996,1995,1994,1993,1992,1991,1990,1989,1988,1987,1986,1985,1984,1983,1982,1981,1980,1979,1978,1977,1976,1975,1974,1973,1972
This statistics in other country:
Timeline:
This timeline shows a graph from 1972 to 2016 of Ecuador. No data until 1971. Number of actual observations by date: 45.
Source name:
World Development Indicators
Source organization:
Estimates based on sources and methods described in "The Changing Wealth of Nations: Measuring Sustainable Development in the New Millennium" (World Bank, 2011).
Categories, topics:
Energy & Mining, Environment
Last updated:
apr 23, 2017
Indicators value changes by year
At the date of observation
Value
Absolute change
Change from previous value
jan 1, 2003
0.007
+0.007
%
jan 1, 2004
0.012
+0.004
61.89%
jan 1, 2005
0.019
+0.007
63.61%
jan 1, 2006
0.03
+0.011
54.73%
jan 1, 2007
0.043
+0.014
45.49%
jan 1, 2008
0.054
+0.01
23.9%
jan 1, 2009
0.05
-0.004
-7.28%
jan 1, 2010
0.03
-0.019
-39.05%
jan 1, 2011
0.022
-0.008
-27.07%
jan 1, 2012
0.031
+0.009
41.61%
jan 1, 2013
0.051
+0.02
63.96%
jan 1, 2014
0.049
-0.002
-4.45%
jan 1, 2015
0.045
-0.004
-7.86%
jan 1, 2016
0.023
-0.022
-48.54%
Ranking of countries by current statistics by years


Comments: