29
/
en
AIzaSyAYiBZKx7MnpbEhh9jyipgxe19OcubqV5w
April 1, 2024
31864
Europe & Central Asia (excluding high income)
ECA
false
2
1
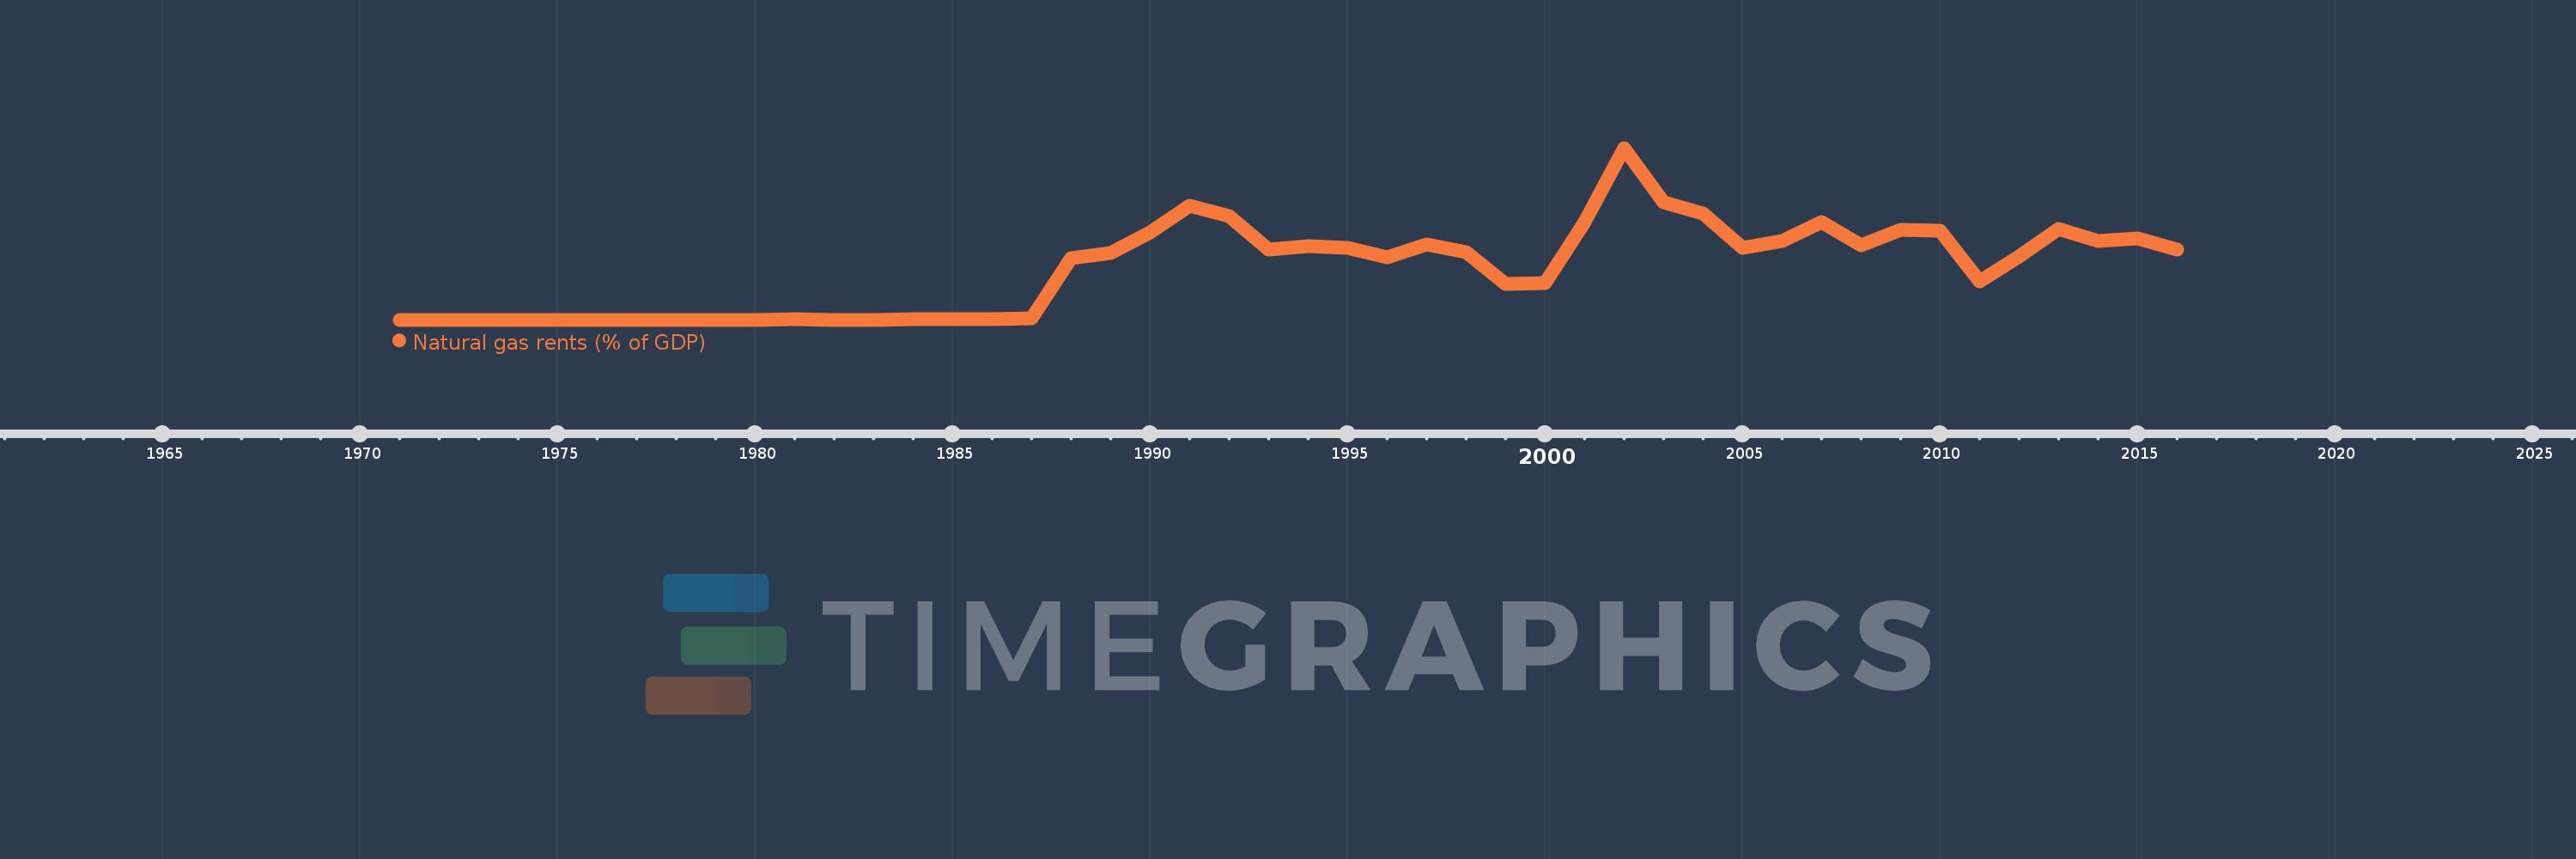
Natural gas rents (% of GDP)
2016,2015,2014,2013,2012,2011,2010,2009,2008,2007,2006,2005,2004,2003,2002,2001,2000,1999,1998,1997,1996,1995,1994,1993,1992,1991,1990,1989,1988,1987,1986,1985,1984,1983,1982,1981,1980,1979,1978,1977,1976,1975,1974,1973,1972,1971
This statistics in other country:
Timeline:
This timeline shows a graph from 1971 to 2016 of Europe & Central Asia (excluding high income). No data until 1970. Number of actual observations by date: 46.
Source name:
World Development Indicators
Source organization:
Estimates based on sources and methods described in "The Changing Wealth of Nations: Measuring Sustainable Development in the New Millennium" (World Bank, 2011).
Categories, topics:
Energy & Mining, Environment
Last updated:
apr 23, 2017
Indicators value changes by year
At the date of observation
Value
Absolute change
Change from previous value
jan 1, 1981
0.005
+0.005
%
jan 1, 1982
0.003
-0.002
-40.49%
jan 1, 1983
0.002
-0.002
-49.79%
jan 1, 1984
0.007
+0.006
350.81%
jan 1, 1985
0.021
+0.013
183.76%
jan 1, 1986
0.022
+0.001
4.78%
jan 1, 1987
0.035
+0.013
61.32%
jan 1, 1988
1.732
+1.697
4.86K%
jan 1, 1989
1.874
+0.142
8.2%
jan 1, 1990
2.451
+0.577
30.8%
jan 1, 1991
3.2
+0.749
30.54%
jan 1, 1992
2.896
-0.304
-9.5%
jan 1, 1993
1.973
-0.923
-31.88%
jan 1, 1994
2.075
+0.102
5.18%
jan 1, 1995
2.02
-0.056
-2.68%
jan 1, 1996
1.753
-0.267
-13.2%
jan 1, 1997
2.109
+0.356
20.32%
jan 1, 1998
1.886
-0.223
-10.57%
jan 1, 1999
1.014
-0.873
-46.27%
jan 1, 2000
1.017
+0.003
0.32%
jan 1, 2001
2.73
+1.714
168.54%
jan 1, 2002
4.816
+2.085
76.37%
jan 1, 2003
3.286
-1.53
-31.77%
jan 1, 2004
2.988
-0.298
-9.06%
jan 1, 2005
2.02
-0.969
-32.42%
jan 1, 2006
2.217
+0.197
9.77%
jan 1, 2007
2.727
+0.511
23.03%
jan 1, 2008
2.086
-0.642
-23.52%
jan 1, 2009
2.52
+0.435
20.83%
jan 1, 2010
2.498
-0.022
-0.89%
jan 1, 2011
1.086
-1.412
-56.52%
jan 1, 2012
1.776
+0.69
63.56%
jan 1, 2013
2.542
+0.766
43.1%
jan 1, 2014
2.213
-0.329
-12.96%
jan 1, 2015
2.279
+0.066
2.98%
jan 1, 2016
1.966
-0.313
-13.73%
Ranking of countries by current statistics by years


Comments: