29
/
en
AIzaSyAYiBZKx7MnpbEhh9jyipgxe19OcubqV5w
April 1, 2024
156326
Indonesia
IDN
true
2
1
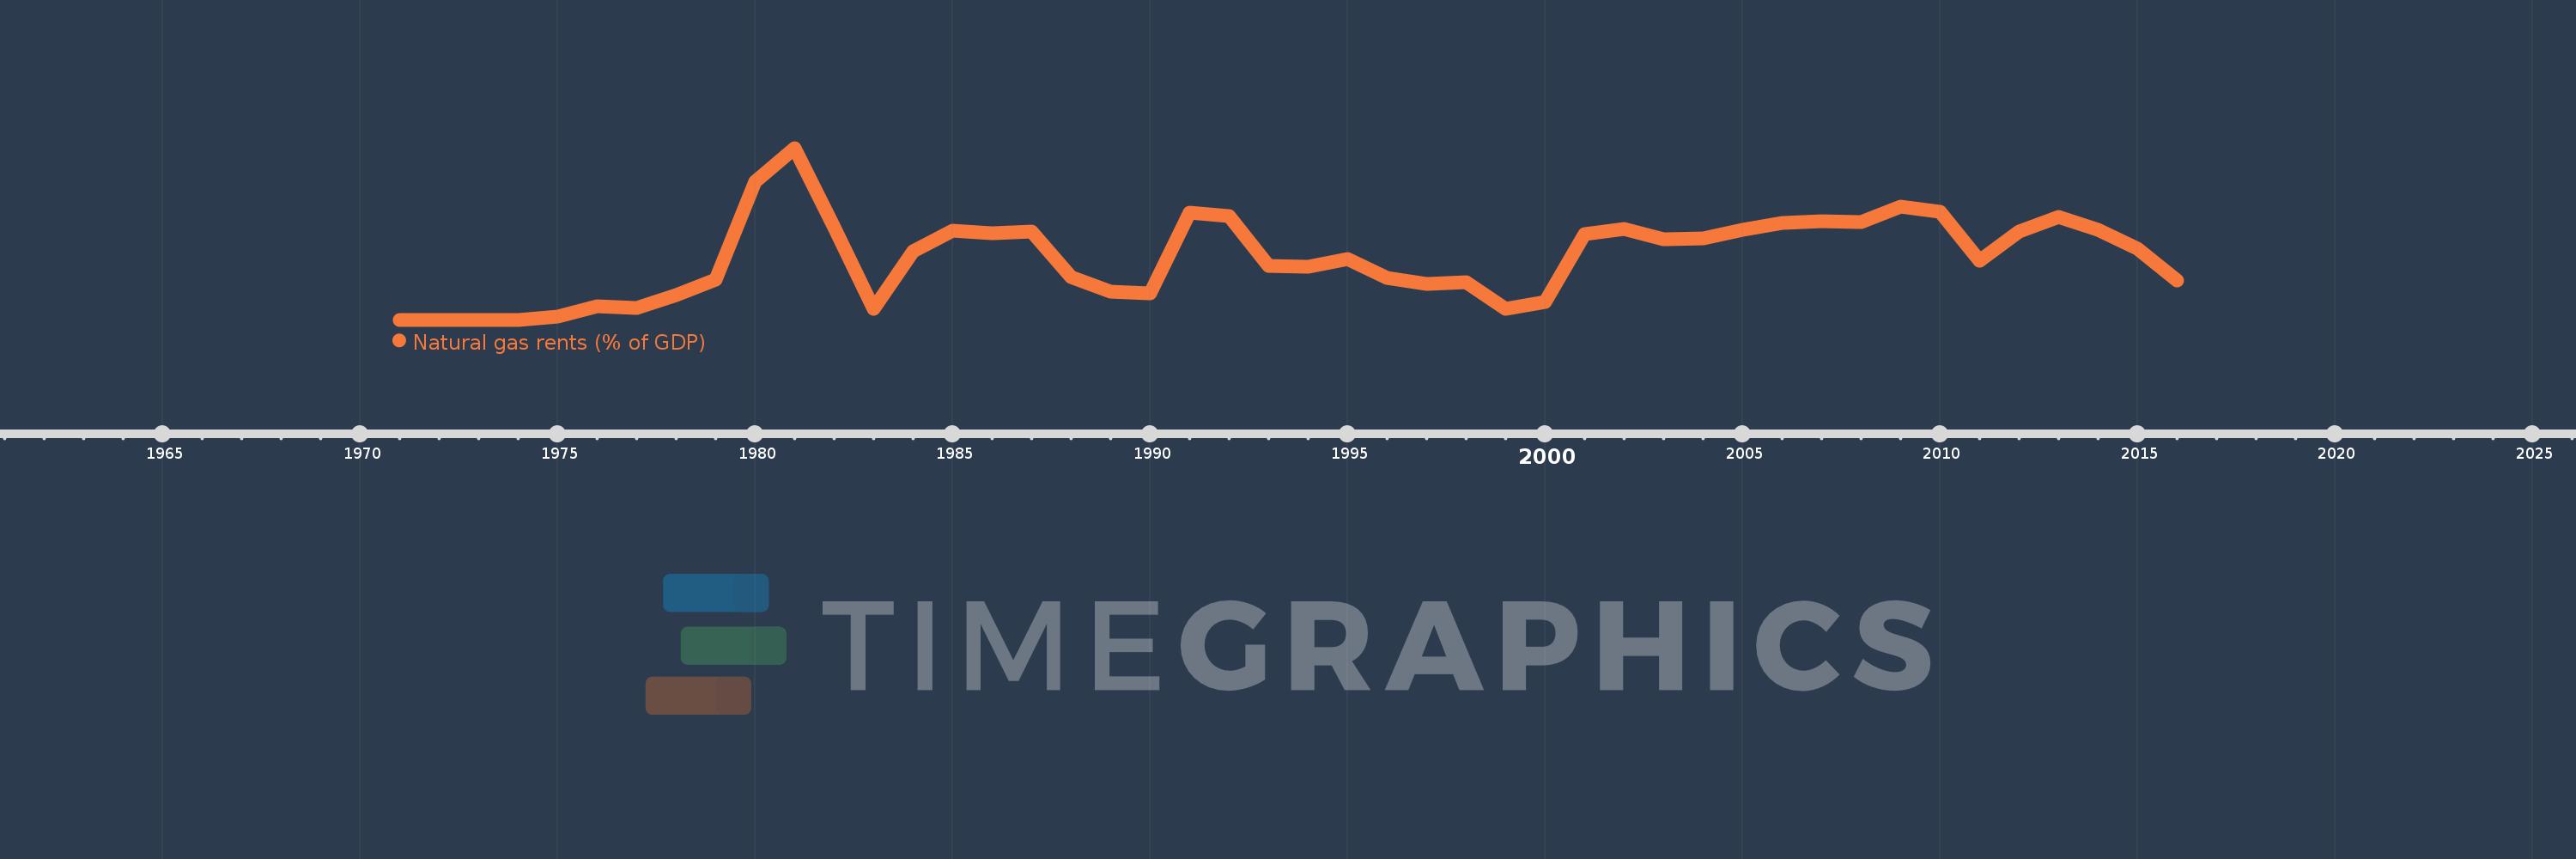
Natural gas rents (% of GDP)
2016,2015,2014,2013,2012,2011,2010,2009,2008,2007,2006,2005,2004,2003,2002,2001,2000,1999,1998,1997,1996,1995,1994,1993,1992,1991,1990,1989,1988,1987,1986,1985,1984,1983,1982,1981,1980,1979,1978,1977,1976,1975,1974,1973,1972,1971
This statistics in other country:
Timeline:
This timeline shows a graph from 1971 to 2016 of Indonesia. No data until 1970. Number of actual observations by date: 46.
Source name:
World Development Indicators
Source organization:
Estimates based on sources and methods described in "The Changing Wealth of Nations: Measuring Sustainable Development in the New Millennium" (World Bank, 2011).
Categories, topics:
Energy & Mining, Environment
Last updated:
apr 23, 2017
Indicators value changes by year
At the date of observation
Value
Absolute change
Change from previous value
jan 1, 1974
0.0
0.0
-100.0%
jan 1, 1976
0.083
+0.063
312.1%
jan 1, 1977
0.07
-0.013
-15.26%
jan 1, 1978
0.149
+0.079
112.33%
jan 1, 1979
0.24
+0.09
60.68%
jan 1, 1980
0.832
+0.593
247.36%
jan 1, 1981
1.037
+0.205
24.62%
jan 1, 1982
0.558
-0.479
-46.22%
jan 1, 1983
0.068
-0.49
-87.83%
jan 1, 1984
0.414
+0.346
510.58%
jan 1, 1985
0.538
+0.123
29.78%
jan 1, 1986
0.52
-0.018
-3.31%
jan 1, 1987
0.535
+0.015
2.82%
jan 1, 1988
0.256
-0.279
-52.11%
jan 1, 1989
0.172
-0.084
-32.68%
jan 1, 1990
0.16
-0.012
-7.04%
jan 1, 1991
0.647
+0.487
303.99%
jan 1, 1992
0.627
-0.021
-3.19%
jan 1, 1993
0.326
-0.301
-48.04%
jan 1, 1994
0.32
-0.006
-1.76%
jan 1, 1995
0.364
+0.044
13.66%
jan 1, 1996
0.251
-0.113
-30.98%
jan 1, 1997
0.218
-0.033
-13.2%
jan 1, 1998
0.227
+0.01
4.46%
jan 1, 1999
0.064
-0.163
-71.83%
jan 1, 2000
0.106
+0.042
65.82%
jan 1, 2001
0.519
+0.413
388.84%
jan 1, 2002
0.548
+0.029
5.53%
jan 1, 2003
0.487
-0.061
-11.08%
jan 1, 2004
0.489
+0.001
0.29%
jan 1, 2005
0.541
+0.052
10.65%
jan 1, 2006
0.584
+0.043
7.88%
jan 1, 2007
0.596
+0.012
2.05%
jan 1, 2008
0.589
-0.007
-1.1%
jan 1, 2009
0.681
+0.092
15.66%
jan 1, 2010
0.651
-0.03
-4.37%
jan 1, 2011
0.357
-0.294
-45.17%
jan 1, 2012
0.533
+0.176
49.2%
jan 1, 2013
0.623
+0.09
16.83%
jan 1, 2014
0.543
-0.08
-12.78%
jan 1, 2015
0.43
-0.113
-20.89%
jan 1, 2016
0.237
-0.193
-44.88%
Ranking of countries by current statistics by years


Comments: