29
/
en
AIzaSyAYiBZKx7MnpbEhh9jyipgxe19OcubqV5w
April 1, 2024
113910
Cote d'Ivoire
CIV
true
2
1
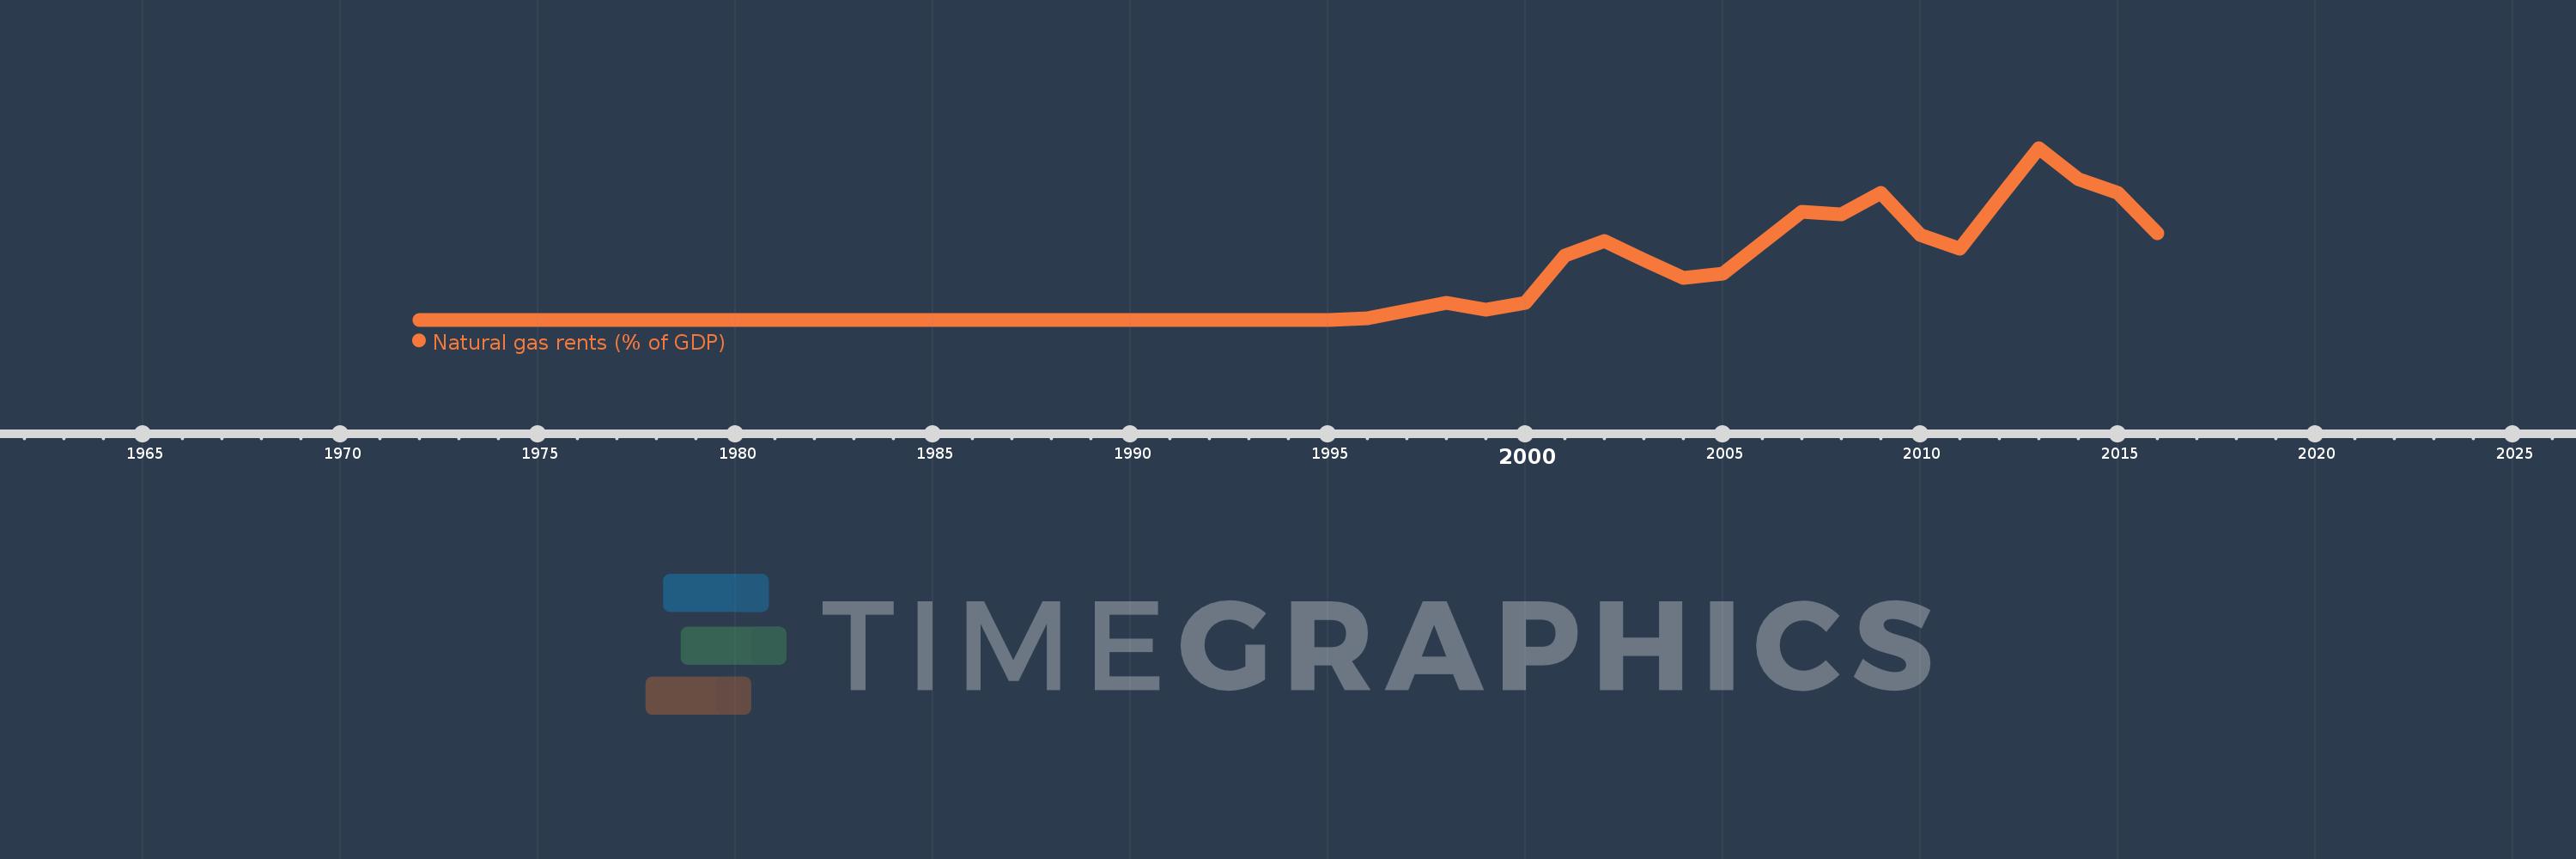
Natural gas rents (% of GDP)
2016,2015,2014,2013,2012,2011,2010,2009,2008,2007,2006,2005,2004,2003,2002,2001,2000,1999,1998,1997,1996,1995,1994,1993,1992,1991,1990,1989,1988,1987,1986,1985,1984,1983,1982,1981,1980,1979,1978,1977,1976,1975,1974,1973,1972
This statistics in other country:
Timeline:
This timeline shows a graph from 1972 to 2016 of Cote d'Ivoire. No data until 1971. Number of actual observations by date: 45.
Source name:
World Development Indicators
Source organization:
Estimates based on sources and methods described in "The Changing Wealth of Nations: Measuring Sustainable Development in the New Millennium" (World Bank, 2011).
Categories, topics:
Energy & Mining, Environment
Last updated:
apr 23, 2017
Indicators value changes by year
At the date of observation
Value
Absolute change
Change from previous value
jan 1, 1996
0.003
+0.003
%
jan 1, 1997
0.025
+0.023
861.81%
jan 1, 1998
0.046
+0.021
81.98%
jan 1, 1999
0.026
-0.02
-42.7%
jan 1, 2000
0.046
+0.019
73.64%
jan 1, 2001
0.171
+0.125
273.39%
jan 1, 2002
0.209
+0.039
22.59%
jan 1, 2003
0.16
-0.05
-23.79%
jan 1, 2004
0.112
-0.047
-29.74%
jan 1, 2005
0.123
+0.011
9.67%
jan 1, 2006
0.206
+0.083
67.64%
jan 1, 2007
0.288
+0.082
39.75%
jan 1, 2008
0.28
-0.008
-2.9%
jan 1, 2009
0.337
+0.057
20.44%
jan 1, 2010
0.226
-0.11
-32.78%
jan 1, 2011
0.188
-0.039
-17.08%
jan 1, 2012
0.323
+0.136
72.17%
jan 1, 2013
0.457
+0.133
41.27%
jan 1, 2014
0.374
-0.082
-18.02%
jan 1, 2015
0.338
-0.037
-9.75%
jan 1, 2016
0.23
-0.108
-32.04%
Ranking of countries by current statistics by years


Comments: