29
/
en
AIzaSyAYiBZKx7MnpbEhh9jyipgxe19OcubqV5w
April 1, 2024
261232
Tanzania
TZA
true
2
1
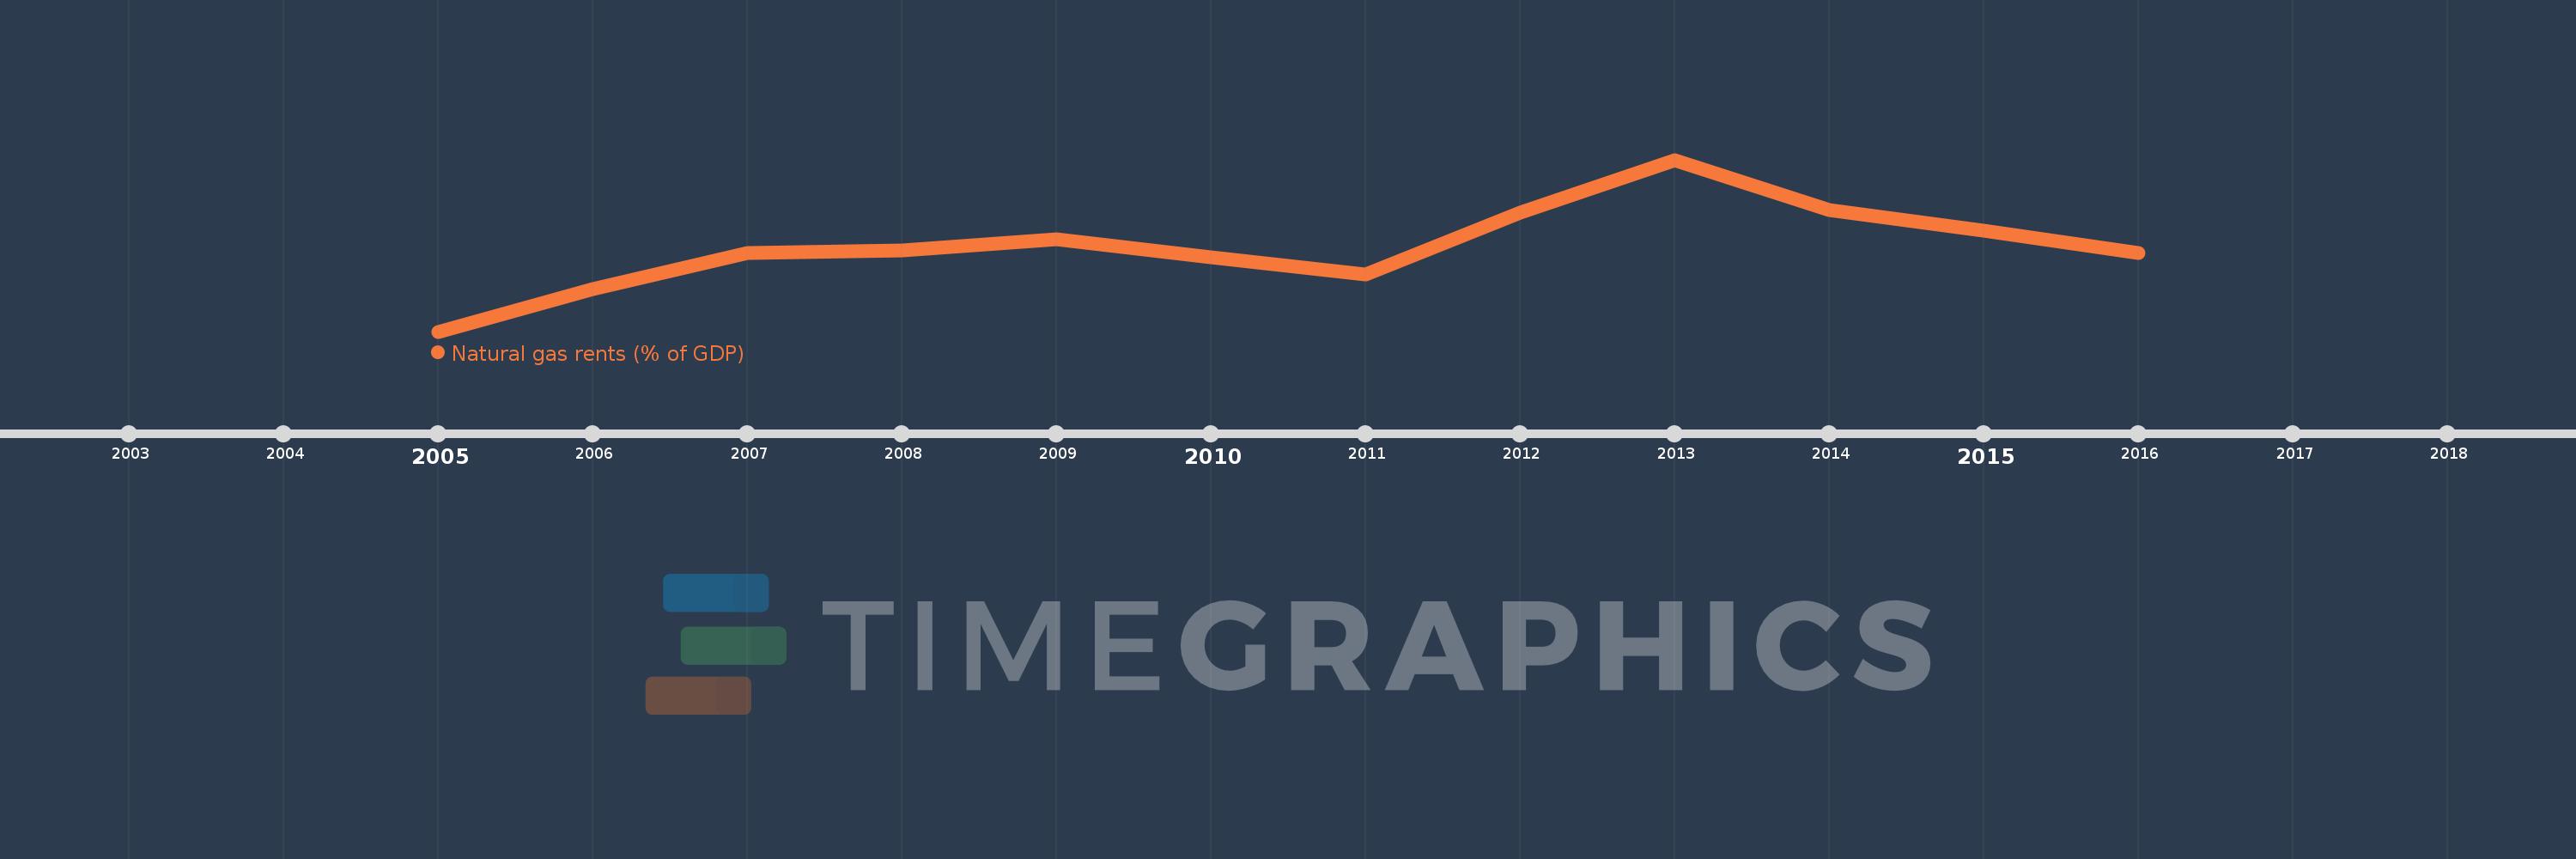
Natural gas rents (% of GDP)
2016,2015,2014,2013,2012,2011,2010,2009,2008,2007,2006,2005
This statistics in other country:
Timeline:
This timeline shows a graph from 2005 to 2016 of Tanzania. No data until 2004. Number of actual observations by date: 12.
Source name:
World Development Indicators
Source organization:
Estimates based on sources and methods described in "The Changing Wealth of Nations: Measuring Sustainable Development in the New Millennium" (World Bank, 2011).
Categories, topics:
Energy & Mining, Environment
Last updated:
apr 23, 2017
Indicators value changes by year
At the date of observation
Value
Absolute change
Change from previous value
jan 1, 2005
0.012
+0.012
0.0%
jan 1, 2006
0.049
+0.037
297.52%
jan 1, 2007
0.081
+0.033
66.98%
jan 1, 2008
0.083
+0.002
2.45%
jan 1, 2009
0.093
+0.009
11.21%
jan 1, 2010
0.077
-0.016
-17.44%
jan 1, 2011
0.062
-0.014
-18.5%
jan 1, 2012
0.116
+0.054
86.2%
jan 1, 2013
0.162
+0.046
39.27%
jan 1, 2014
0.118
-0.044
-26.94%
jan 1, 2015
0.1
-0.018
-15.49%
jan 1, 2016
0.081
-0.019
-19.33%
Ranking of countries by current statistics by years


Comments: