29
/
en
AIzaSyAYiBZKx7MnpbEhh9jyipgxe19OcubqV5w
April 1, 2024
91482
Brazil
BRA
true
2
1
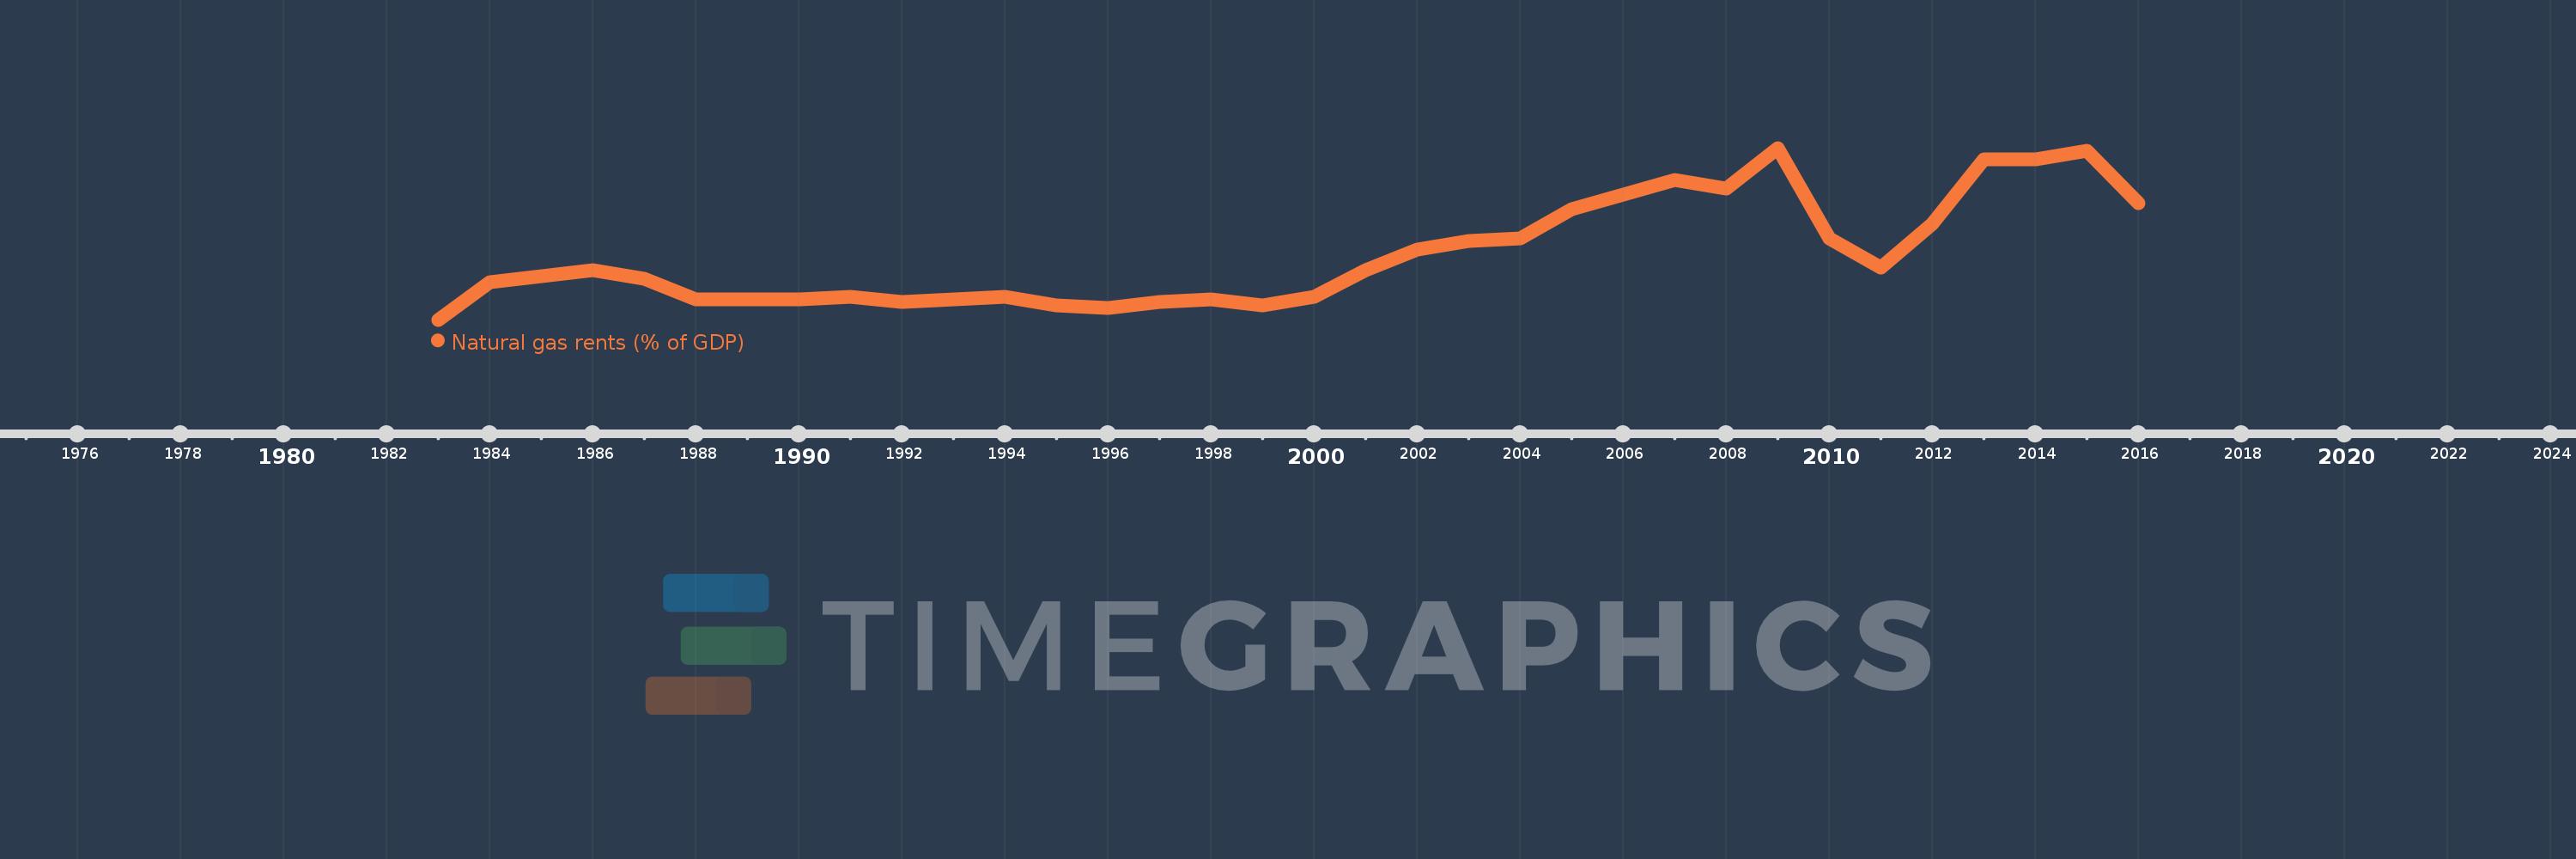
Natural gas rents (% of GDP)
2016,2015,2014,2013,2012,2011,2010,2009,2008,2007,2006,2005,2004,2003,2002,2001,2000,1999,1998,1997,1996,1995,1994,1993,1992,1991,1990,1989,1988,1987,1986,1985,1984,1983
This statistics in other country:
Timeline:
This timeline shows a graph from 1983 to 2016 of Brazil. No data until 1982. Number of actual observations by date: 34.
Source name:
World Development Indicators
Source organization:
Estimates based on sources and methods described in "The Changing Wealth of Nations: Measuring Sustainable Development in the New Millennium" (World Bank, 2011).
Categories, topics:
Energy & Mining, Environment
Last updated:
apr 23, 2017
Indicators value changes by year
At the date of observation
Value
Absolute change
Change from previous value
jan 1, 1983
0.001
+0.001
0.0%
jan 1, 1984
0.014
+0.014
1.61K%
jan 1, 1985
0.016
+0.002
10.63%
jan 1, 1986
0.018
+0.002
13.89%
jan 1, 1987
0.015
-0.003
-19.19%
jan 1, 1988
0.008
-0.007
-45.62%
jan 1, 1989
0.008
0.0
-2.7%
jan 1, 1990
0.008
+0.0
0.52%
jan 1, 1991
0.009
+0.002
19.65%
jan 1, 1992
0.007
-0.002
-25.48%
jan 1, 1993
0.008
+0.001
12.04%
jan 1, 1994
0.009
+0.002
21.36%
jan 1, 1995
0.006
-0.003
-31.9%
jan 1, 1996
0.005
-0.001
-20.89%
jan 1, 1997
0.007
+0.002
44.09%
jan 1, 1998
0.008
+0.001
10.53%
jan 1, 1999
0.006
-0.002
-26.51%
jan 1, 2000
0.009
+0.003
54.3%
jan 1, 2001
0.018
+0.009
96.03%
jan 1, 2002
0.025
+0.007
39.03%
jan 1, 2003
0.028
+0.003
12.41%
jan 1, 2004
0.029
+0.001
4.16%
jan 1, 2005
0.039
+0.01
32.71%
jan 1, 2006
0.044
+0.005
12.23%
jan 1, 2007
0.049
+0.006
12.84%
jan 1, 2008
0.046
-0.004
-7.72%
jan 1, 2009
0.06
+0.014
31.47%
jan 1, 2010
0.029
-0.031
-52.4%
jan 1, 2011
0.019
-0.009
-32.33%
jan 1, 2012
0.034
+0.015
76.85%
jan 1, 2013
0.056
+0.022
63.37%
jan 1, 2014
0.056
+0.0
0.58%
jan 1, 2015
0.059
+0.003
4.58%
jan 1, 2016
0.041
-0.018
-30.5%
Ranking of countries by current statistics by years


Comments: