29
/
en
AIzaSyAYiBZKx7MnpbEhh9jyipgxe19OcubqV5w
April 1, 2024
73258
Australia
AUS
true
2
1
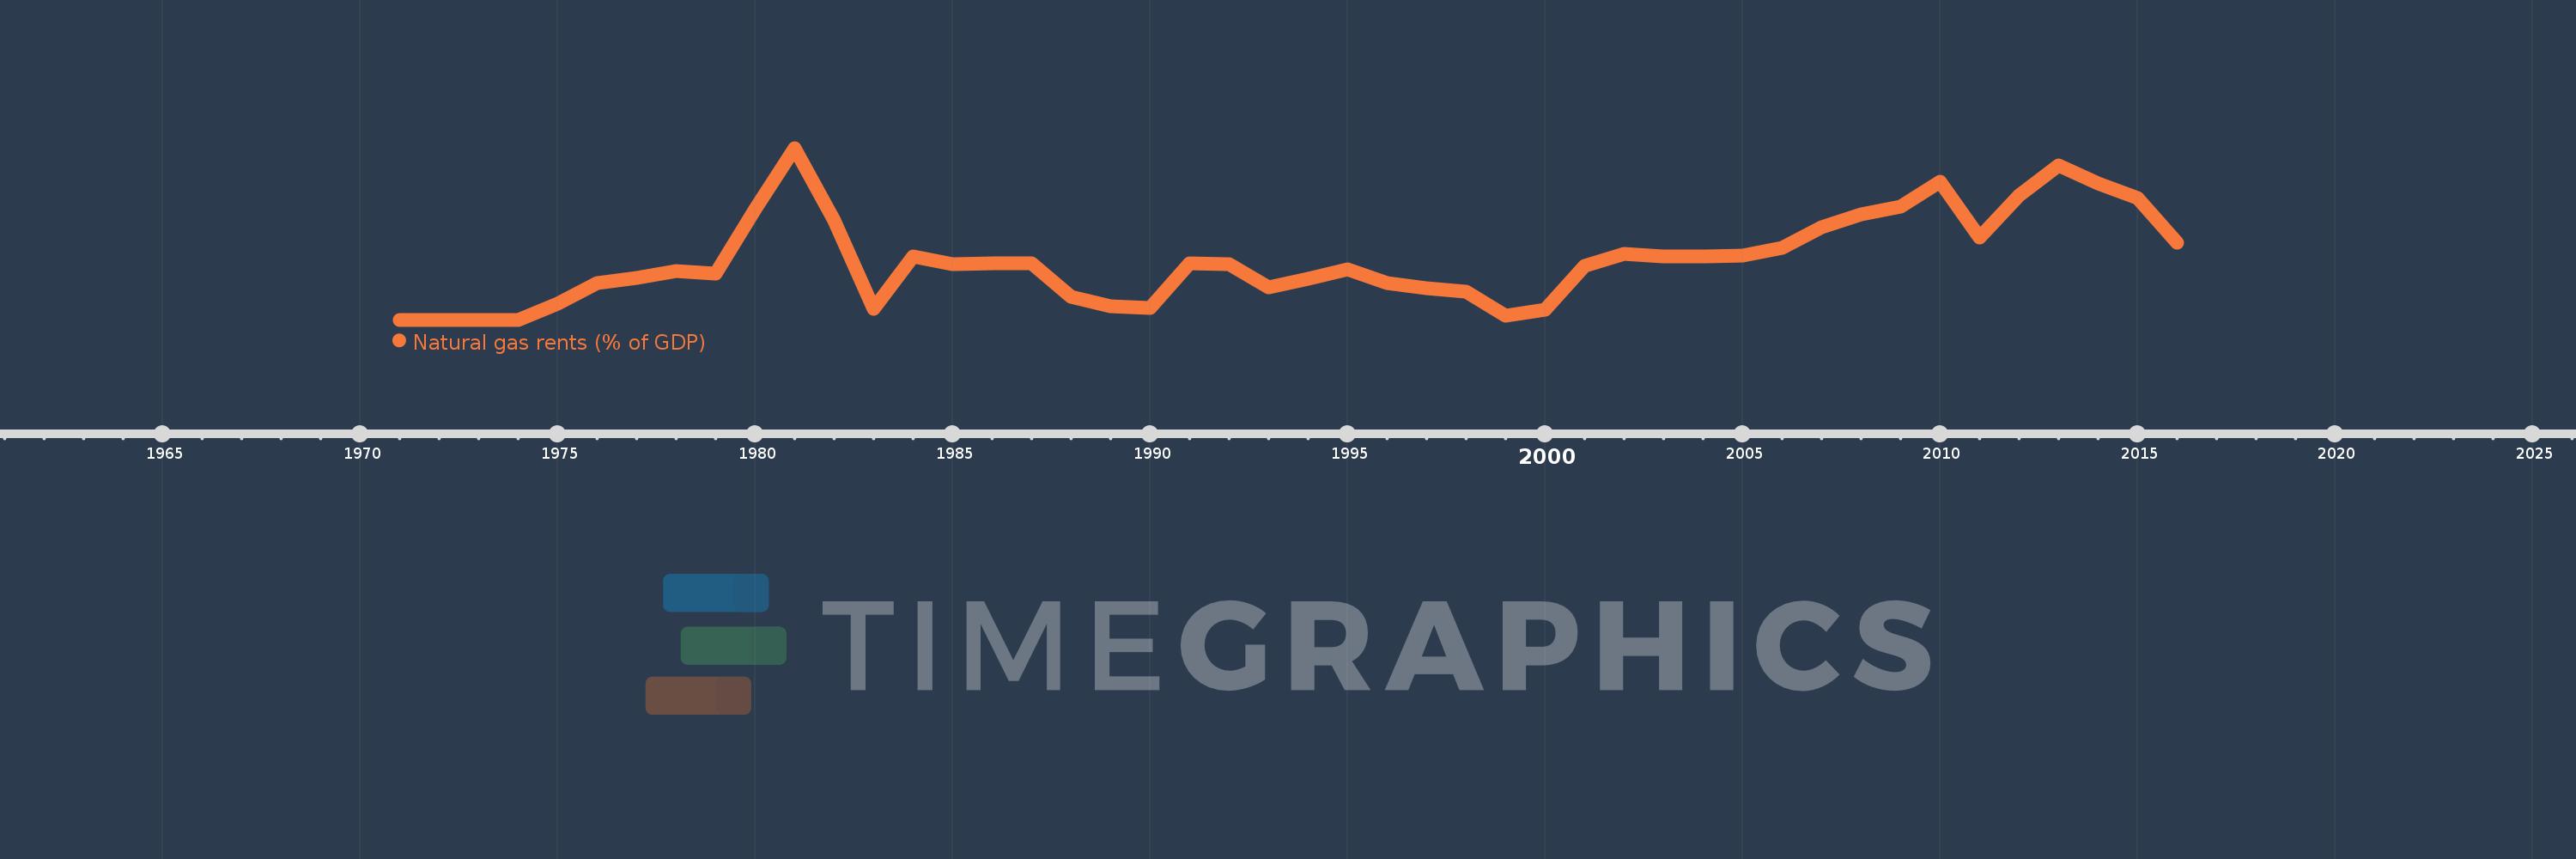
Natural gas rents (% of GDP)
2016,2015,2014,2013,2012,2011,2010,2009,2008,2007,2006,2005,2004,2003,2002,2001,2000,1999,1998,1997,1996,1995,1994,1993,1992,1991,1990,1989,1988,1987,1986,1985,1984,1983,1982,1981,1980,1979,1978,1977,1976,1975,1974,1973,1972,1971
This statistics in other country:
Timeline:
This timeline shows a graph from 1971 to 2016 of Australia. No data until 1970. Number of actual observations by date: 46.
Source name:
World Development Indicators
Source organization:
Estimates based on sources and methods described in "The Changing Wealth of Nations: Measuring Sustainable Development in the New Millennium" (World Bank, 2011).
Categories, topics:
Energy & Mining, Environment
Last updated:
apr 23, 2017
Indicators value changes by year
At the date of observation
Value
Absolute change
Change from previous value
jan 1, 1974
0.0
0.0
-100.0%
jan 1, 1975
0.028
+0.028
%
jan 1, 1976
0.065
+0.037
131.03%
jan 1, 1977
0.073
+0.008
12.39%
jan 1, 1978
0.086
+0.013
17.84%
jan 1, 1979
0.081
-0.005
-5.86%
jan 1, 1980
0.195
+0.114
141.9%
jan 1, 1981
0.302
+0.107
54.7%
jan 1, 1982
0.174
-0.128
-42.5%
jan 1, 1983
0.019
-0.154
-88.78%
jan 1, 1984
0.111
+0.092
472.06%
jan 1, 1985
0.098
-0.013
-12.1%
jan 1, 1986
0.099
+0.001
1.11%
jan 1, 1987
0.099
+0.0
0.08%
jan 1, 1988
0.041
-0.058
-58.16%
jan 1, 1989
0.023
-0.018
-43.85%
jan 1, 1990
0.021
-0.002
-10.57%
jan 1, 1991
0.099
+0.078
375.26%
jan 1, 1992
0.097
-0.001
-1.47%
jan 1, 1993
0.057
-0.04
-41.17%
jan 1, 1994
0.072
+0.015
26.32%
jan 1, 1995
0.089
+0.017
22.97%
jan 1, 1996
0.064
-0.025
-27.87%
jan 1, 1997
0.055
-0.009
-14.4%
jan 1, 1998
0.05
-0.005
-8.98%
jan 1, 1999
0.007
-0.043
-85.66%
jan 1, 2000
0.017
+0.01
137.11%
jan 1, 2001
0.095
+0.078
459.57%
jan 1, 2002
0.116
+0.02
21.27%
jan 1, 2003
0.111
-0.005
-4.26%
jan 1, 2004
0.111
+0.0
0.13%
jan 1, 2005
0.113
+0.002
1.98%
jan 1, 2006
0.126
+0.013
11.26%
jan 1, 2007
0.163
+0.038
29.94%
jan 1, 2008
0.186
+0.023
13.9%
jan 1, 2009
0.199
+0.013
6.9%
jan 1, 2010
0.242
+0.043
21.59%
jan 1, 2011
0.145
-0.097
-40.12%
jan 1, 2012
0.218
+0.073
50.75%
jan 1, 2013
0.271
+0.053
24.23%
jan 1, 2014
0.24
-0.032
-11.63%
jan 1, 2015
0.214
-0.025
-10.6%
jan 1, 2016
0.136
-0.078
-36.43%
Ranking of countries by current statistics by years


Comments: