29
/
en
AIzaSyAYiBZKx7MnpbEhh9jyipgxe19OcubqV5w
April 1, 2024
268320
Tunisia
TUN
true
2
1
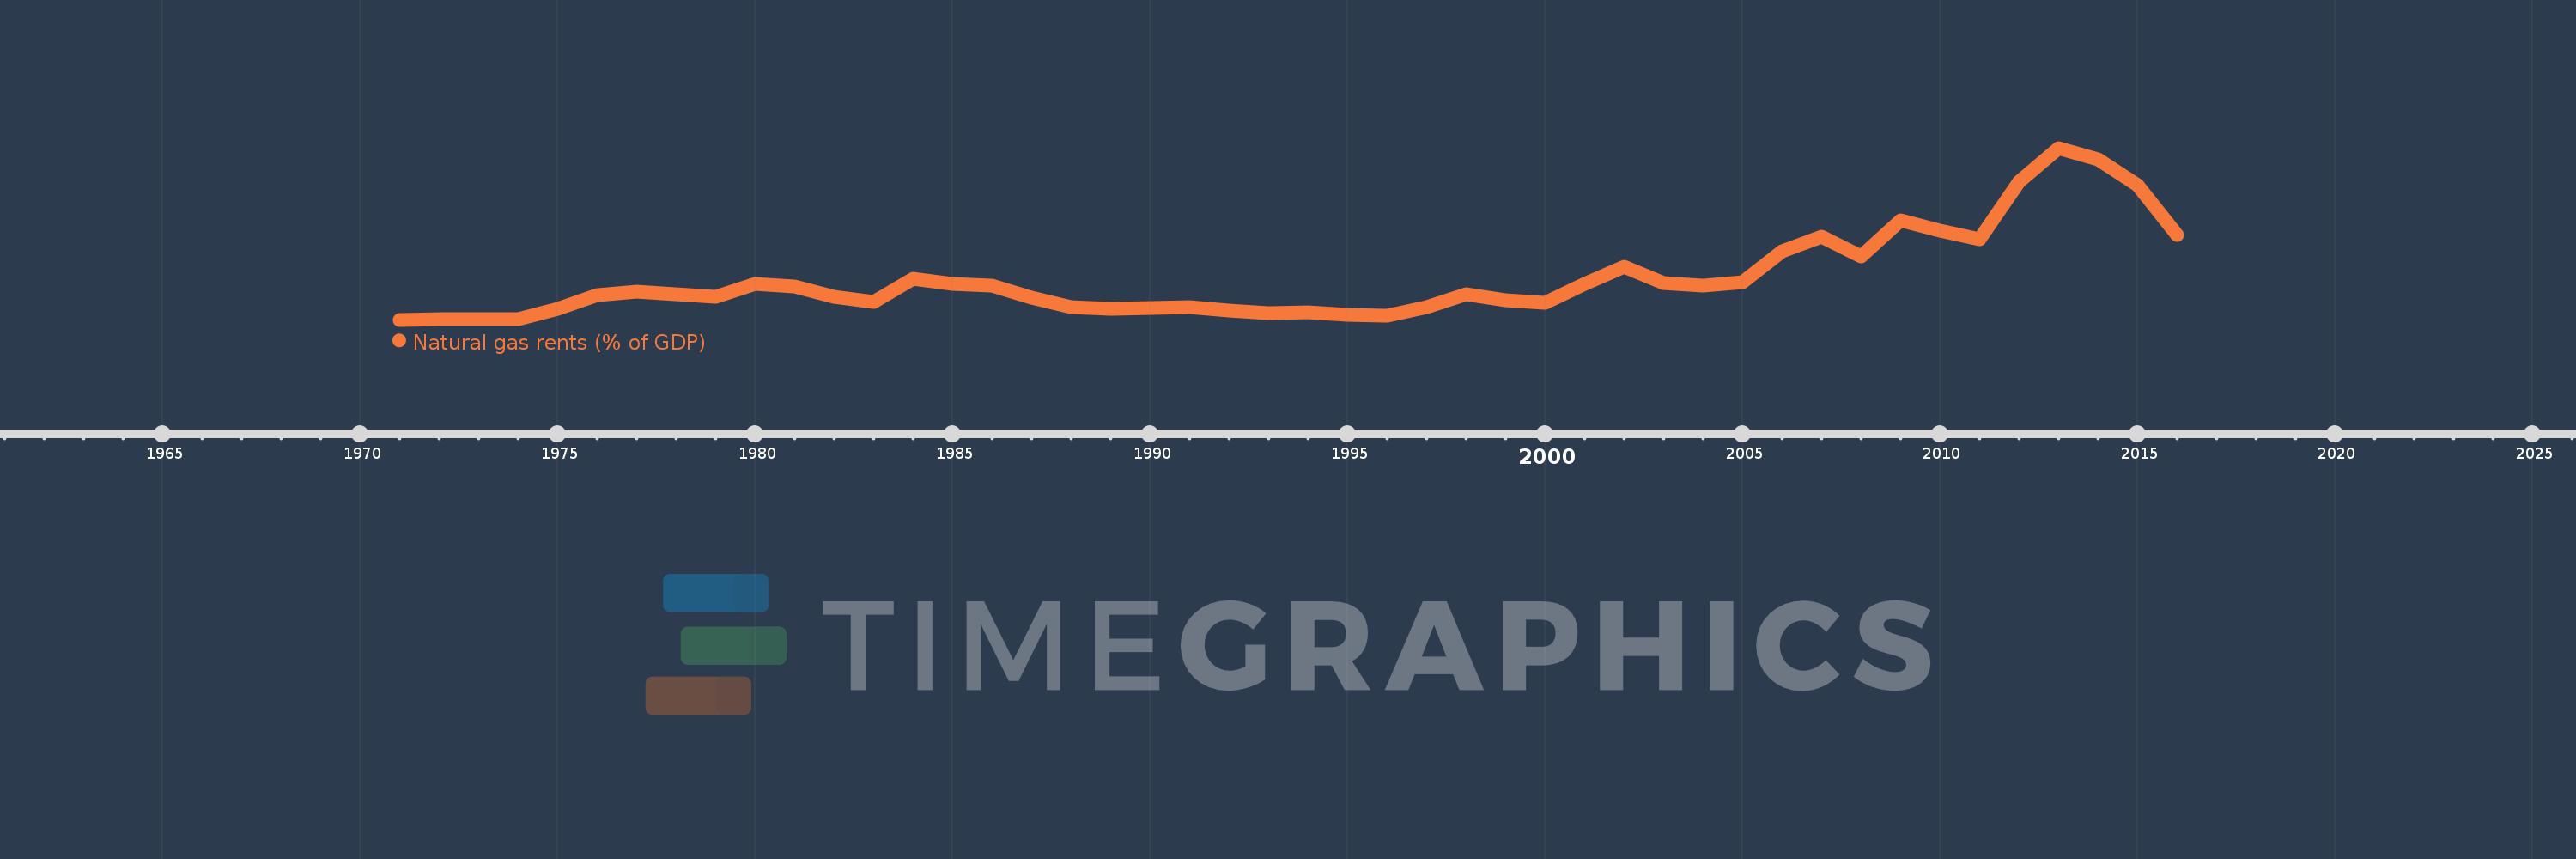
Natural gas rents (% of GDP)
2016,2015,2014,2013,2012,2011,2010,2009,2008,2007,2006,2005,2004,2003,2002,2001,2000,1999,1998,1997,1996,1995,1994,1993,1992,1991,1990,1989,1988,1987,1986,1985,1984,1983,1982,1981,1980,1979,1978,1977,1976,1975,1974,1973,1972,1971
This statistics in other country:
Timeline:
This timeline shows a graph from 1971 to 2016 of Tunisia. No data until 1970. Number of actual observations by date: 46.
Source name:
World Development Indicators
Source organization:
Estimates based on sources and methods described in "The Changing Wealth of Nations: Measuring Sustainable Development in the New Millennium" (World Bank, 2011).
Categories, topics:
Energy & Mining, Environment
Last updated:
apr 23, 2017
Indicators value changes by year
At the date of observation
Value
Absolute change
Change from previous value
jan 1, 1972
0.001
+0.0
15.08%
jan 1, 1973
0.001
+0.0
31.6%
jan 1, 1974
0.003
+0.002
292.45%
jan 1, 1975
0.038
+0.035
1.34K%
jan 1, 1976
0.086
+0.048
128.65%
jan 1, 1977
0.098
+0.013
14.66%
jan 1, 1978
0.091
-0.008
-7.88%
jan 1, 1979
0.081
-0.01
-11.14%
jan 1, 1980
0.126
+0.046
56.93%
jan 1, 1981
0.116
-0.011
-8.61%
jan 1, 1982
0.081
-0.034
-29.52%
jan 1, 1983
0.064
-0.018
-21.9%
jan 1, 1984
0.145
+0.081
127.61%
jan 1, 1985
0.127
-0.018
-12.34%
jan 1, 1986
0.122
-0.005
-3.79%
jan 1, 1987
0.079
-0.043
-34.97%
jan 1, 1988
0.046
-0.033
-41.73%
jan 1, 1989
0.038
-0.008
-17.22%
jan 1, 1990
0.043
+0.005
12.41%
jan 1, 1991
0.044
+0.001
2.8%
jan 1, 1992
0.033
-0.012
-26.0%
jan 1, 1993
0.023
-0.01
-30.71%
jan 1, 1994
0.025
+0.002
9.2%
jan 1, 1995
0.018
-0.007
-29.19%
jan 1, 1996
0.015
-0.003
-16.39%
jan 1, 1997
0.044
+0.029
197.75%
jan 1, 1998
0.091
+0.047
108.39%
jan 1, 1999
0.069
-0.022
-24.43%
jan 1, 2000
0.06
-0.009
-12.92%
jan 1, 2001
0.127
+0.067
112.36%
jan 1, 2002
0.186
+0.058
45.79%
jan 1, 2003
0.13
-0.055
-29.74%
jan 1, 2004
0.119
-0.011
-8.59%
jan 1, 2005
0.133
+0.014
11.7%
jan 1, 2006
0.242
+0.109
81.78%
jan 1, 2007
0.292
+0.05
20.61%
jan 1, 2008
0.225
-0.067
-22.87%
jan 1, 2009
0.351
+0.126
55.88%
jan 1, 2010
0.315
-0.036
-10.33%
jan 1, 2011
0.285
-0.03
-9.48%
jan 1, 2012
0.489
+0.204
71.69%
jan 1, 2013
0.607
+0.118
24.07%
jan 1, 2014
0.567
-0.04
-6.52%
jan 1, 2015
0.477
-0.09
-15.81%
jan 1, 2016
0.3
-0.177
-37.1%
Ranking of countries by current statistics by years


Comments: