29
/
en
AIzaSyAYiBZKx7MnpbEhh9jyipgxe19OcubqV5w
April 1, 2024
70144
Argentina
ARG
true
2
1
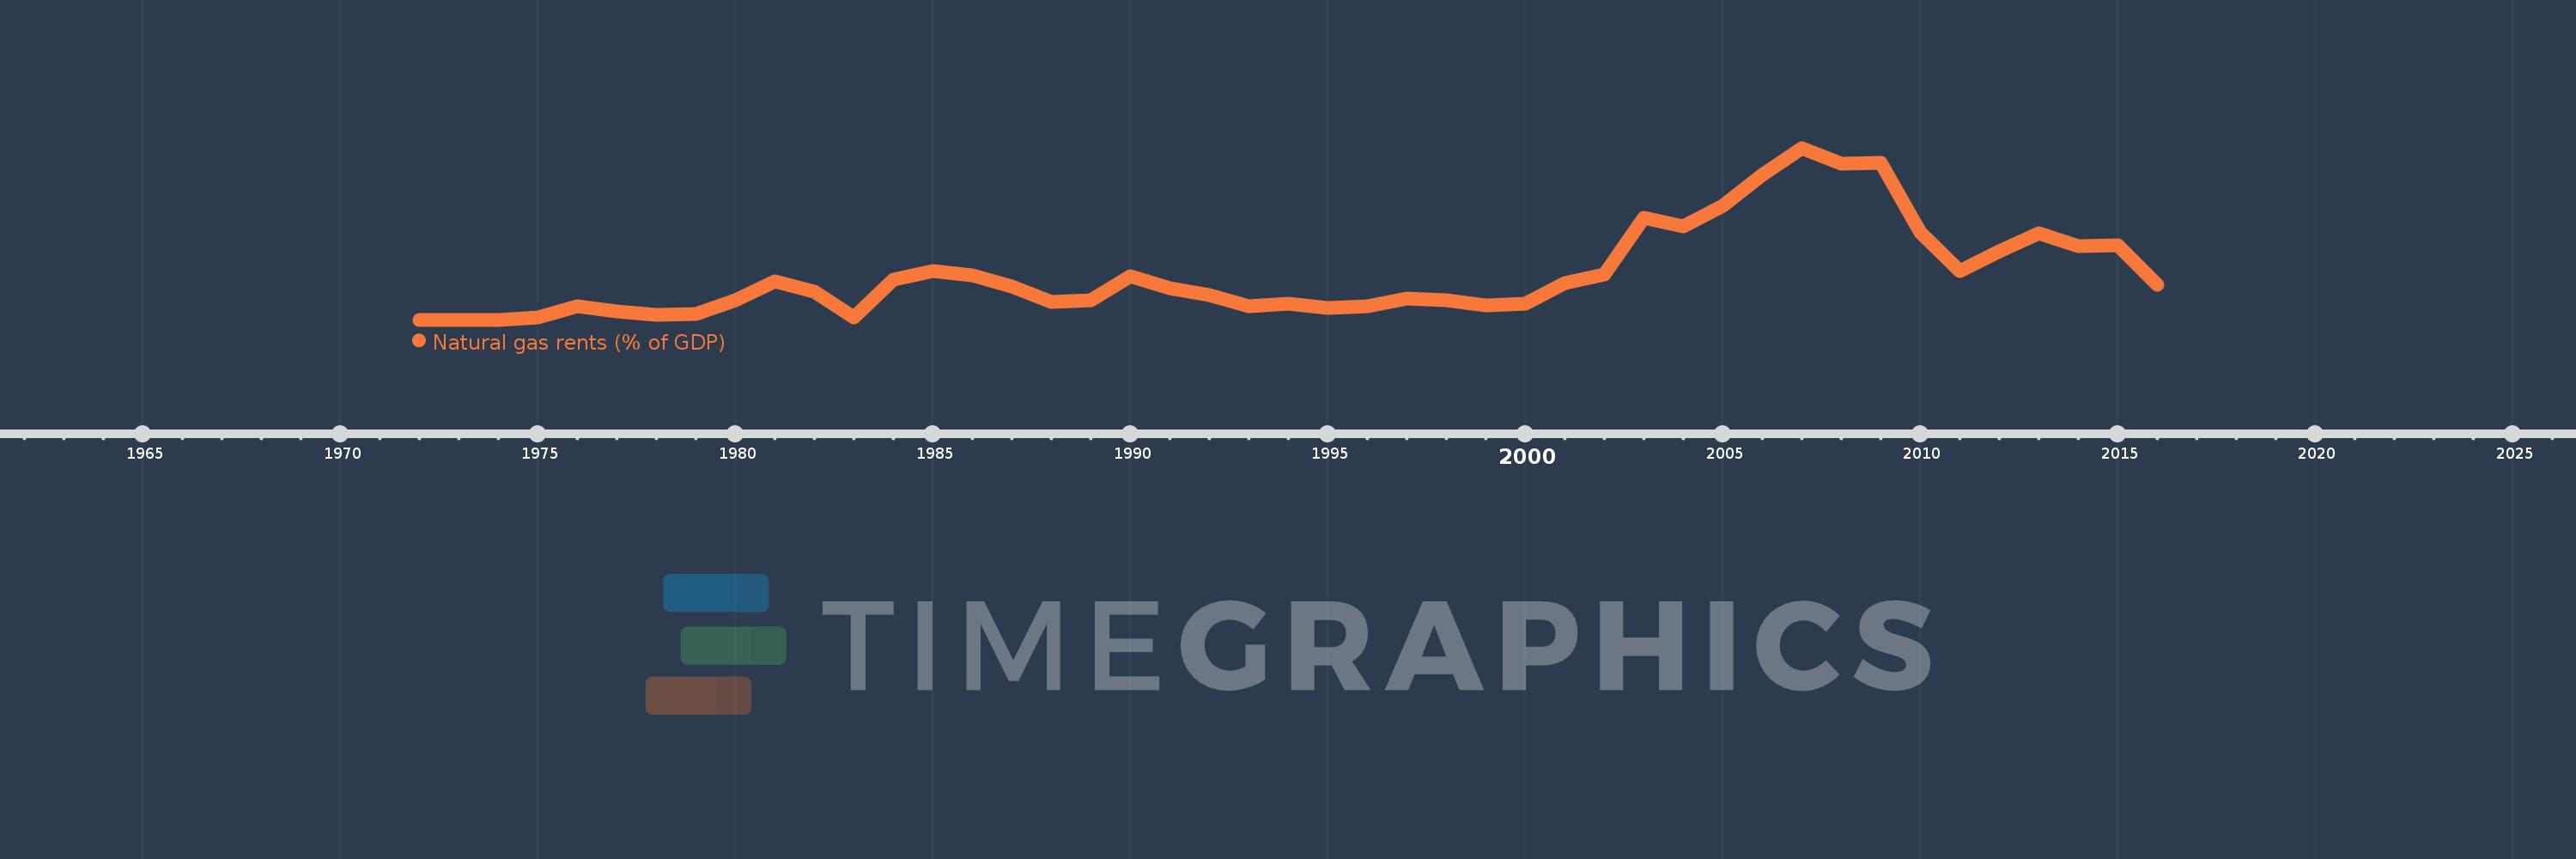
Natural gas rents (% of GDP)
2016,2015,2014,2013,2012,2011,2010,2009,2008,2007,2006,2005,2004,2003,2002,2001,2000,1999,1998,1997,1996,1995,1994,1993,1992,1991,1990,1989,1988,1987,1986,1985,1984,1983,1982,1981,1980,1979,1978,1977,1976,1975,1974,1973,1972
This statistics in other country:
Timeline:
This timeline shows a graph from 1972 to 2016 of Argentina. No data until 1971. Number of actual observations by date: 45.
Source name:
World Development Indicators
Source organization:
Estimates based on sources and methods described in "The Changing Wealth of Nations: Measuring Sustainable Development in the New Millennium" (World Bank, 2011).
Categories, topics:
Energy & Mining, Environment
Last updated:
apr 23, 2017
Indicators value changes by year
At the date of observation
Value
Absolute change
Change from previous value
jan 1, 1975
0.015
+0.015
%
jan 1, 1976
0.074
+0.059
406.5%
jan 1, 1977
0.046
-0.027
-36.96%
jan 1, 1978
0.03
-0.016
-35.2%
jan 1, 1979
0.034
+0.004
12.83%
jan 1, 1980
0.109
+0.076
222.52%
jan 1, 1981
0.216
+0.106
97.12%
jan 1, 1982
0.158
-0.058
-26.8%
jan 1, 1983
0.014
-0.144
-91.03%
jan 1, 1984
0.227
+0.213
1.5K%
jan 1, 1985
0.273
+0.047
20.6%
jan 1, 1986
0.249
-0.024
-8.8%
jan 1, 1987
0.188
-0.062
-24.76%
jan 1, 1988
0.098
-0.089
-47.7%
jan 1, 1989
0.111
+0.013
13.61%
jan 1, 1990
0.245
+0.134
119.97%
jan 1, 1991
0.178
-0.067
-27.35%
jan 1, 1992
0.139
-0.039
-22.13%
jan 1, 1993
0.076
-0.063
-45.06%
jan 1, 1994
0.089
+0.013
17.21%
jan 1, 1995
0.068
-0.022
-24.35%
jan 1, 1996
0.076
+0.009
13.05%
jan 1, 1997
0.12
+0.043
56.53%
jan 1, 1998
0.111
-0.009
-7.25%
jan 1, 1999
0.081
-0.03
-27.37%
jan 1, 2000
0.091
+0.01
12.34%
jan 1, 2001
0.208
+0.117
129.7%
jan 1, 2002
0.254
+0.046
22.01%
jan 1, 2003
0.573
+0.319
125.87%
jan 1, 2004
0.526
-0.047
-8.26%
jan 1, 2005
0.644
+0.119
22.57%
jan 1, 2006
0.817
+0.173
26.85%
jan 1, 2007
0.968
+0.151
18.46%
jan 1, 2008
0.88
-0.088
-9.09%
jan 1, 2009
0.883
+0.003
0.3%
jan 1, 2010
0.494
-0.389
-44.07%
jan 1, 2011
0.275
-0.219
-44.29%
jan 1, 2012
0.388
+0.113
41.01%
jan 1, 2013
0.489
+0.102
26.19%
jan 1, 2014
0.416
-0.074
-15.04%
jan 1, 2015
0.419
+0.004
0.85%
jan 1, 2016
0.198
-0.222
-52.88%
Ranking of countries by current statistics by years


Comments: