29
/
en
AIzaSyAYiBZKx7MnpbEhh9jyipgxe19OcubqV5w
April 1, 2024
228818
Romania
ROU
true
2
1
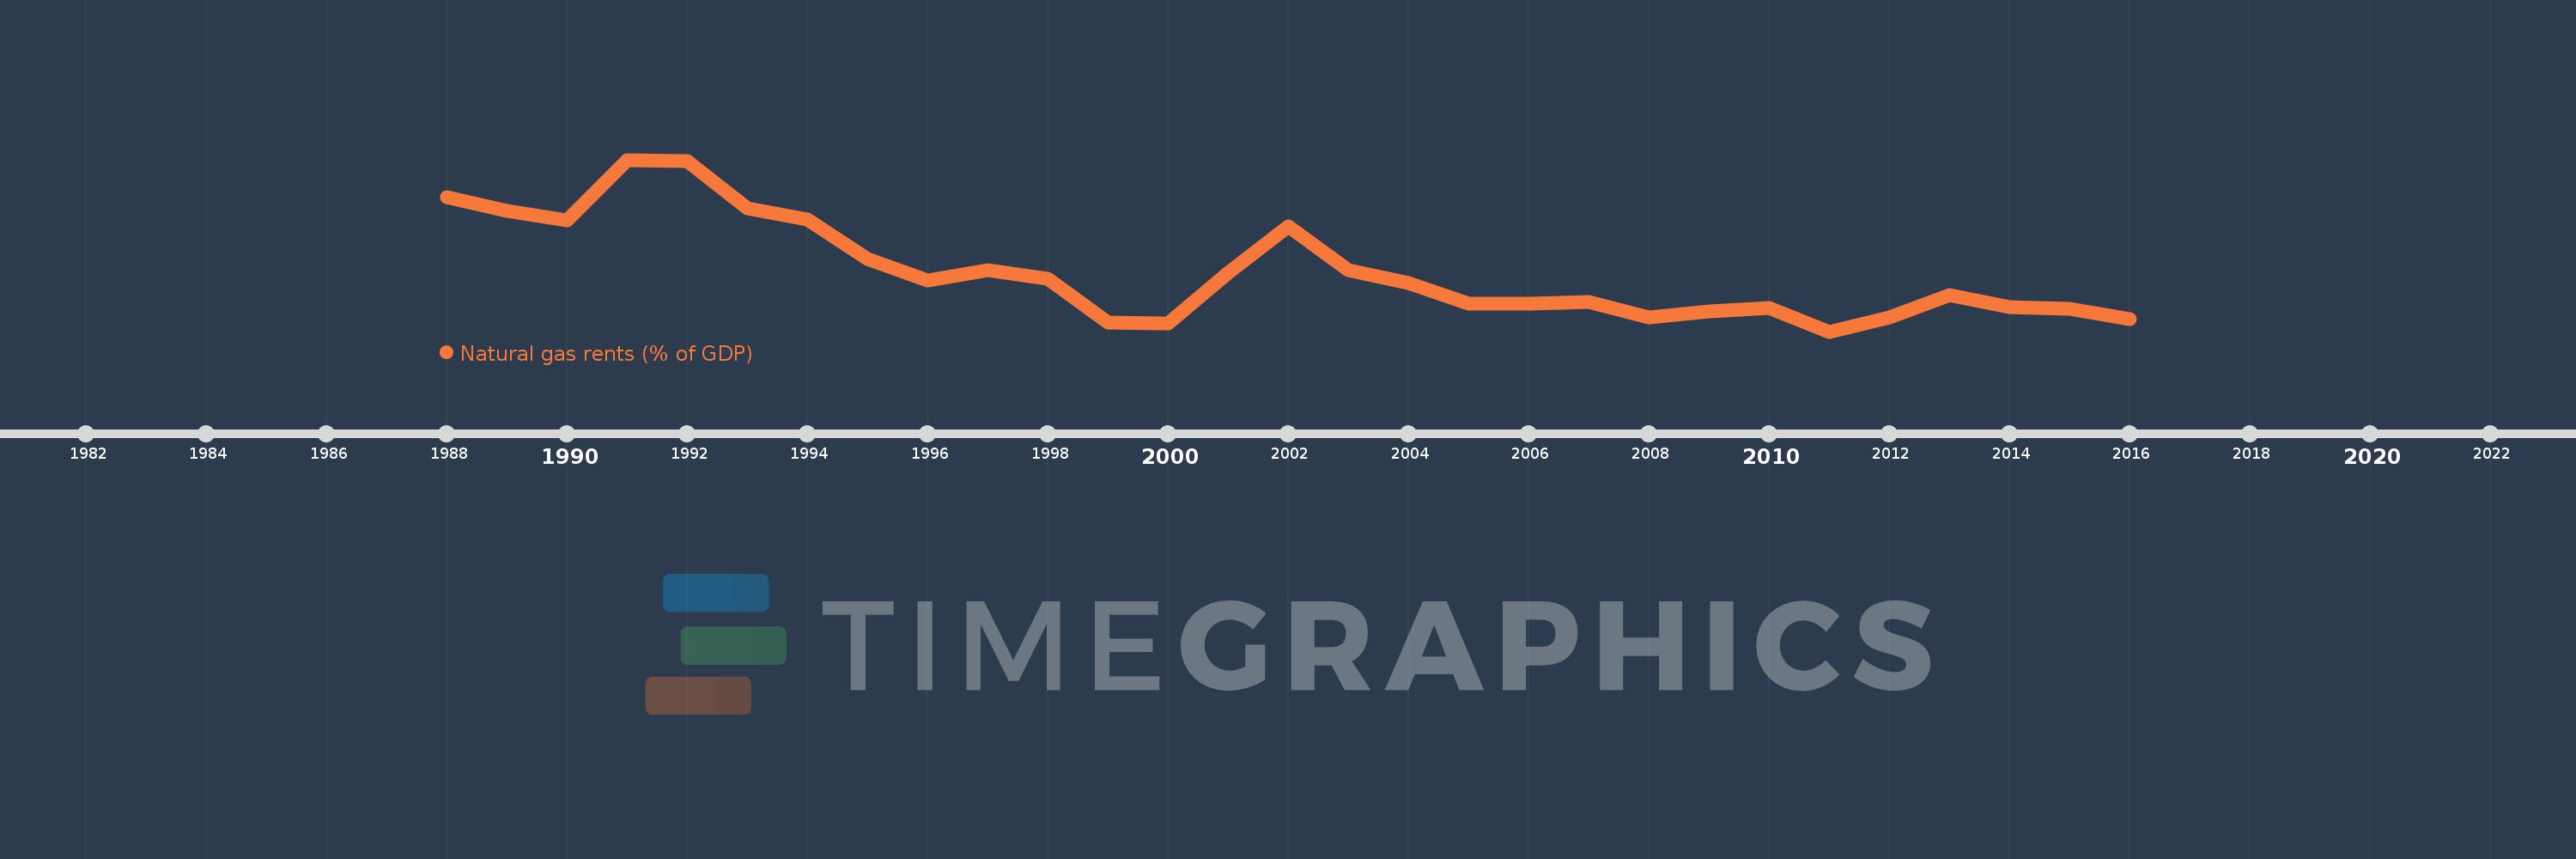
Natural gas rents (% of GDP)
2016,2015,2014,2013,2012,2011,2010,2009,2008,2007,2006,2005,2004,2003,2002,2001,2000,1999,1998,1997,1996,1995,1994,1993,1992,1991,1990,1989,1988
This statistics in other country:
Timeline:
This timeline shows a graph from 1988 to 2016 of Romania. No data until 1987. Number of actual observations by date: 29.
Source name:
World Development Indicators
Source organization:
Estimates based on sources and methods described in "The Changing Wealth of Nations: Measuring Sustainable Development in the New Millennium" (World Bank, 2011).
Categories, topics:
Energy & Mining, Environment
Last updated:
apr 23, 2017
Indicators value changes by year
At the date of observation
Value
Absolute change
Change from previous value
jan 1, 1988
2.122
+2.122
0.0%
jan 1, 1989
1.941
-0.181
-8.52%
jan 1, 1990
1.805
-0.136
-7.0%
jan 1, 1991
2.642
+0.837
46.35%
jan 1, 1992
2.628
-0.014
-0.54%
jan 1, 1993
1.969
-0.659
-25.08%
jan 1, 1994
1.816
-0.153
-7.76%
jan 1, 1995
1.275
-0.541
-29.81%
jan 1, 1996
0.976
-0.298
-23.41%
jan 1, 1997
1.115
+0.139
14.19%
jan 1, 1998
0.993
-0.121
-10.88%
jan 1, 1999
0.391
-0.603
-60.66%
jan 1, 2000
0.383
-0.007
-1.9%
jan 1, 2001
1.083
+0.7
182.45%
jan 1, 2002
1.718
+0.634
58.59%
jan 1, 2003
1.12
-0.597
-34.77%
jan 1, 2004
0.942
-0.178
-15.9%
jan 1, 2005
0.65
-0.292
-31.02%
jan 1, 2006
0.659
+0.009
1.34%
jan 1, 2007
0.674
+0.015
2.28%
jan 1, 2008
0.458
-0.216
-32.09%
jan 1, 2009
0.543
+0.085
18.56%
jan 1, 2010
0.591
+0.049
8.98%
jan 1, 2011
0.268
-0.324
-54.75%
jan 1, 2012
0.465
+0.197
73.76%
jan 1, 2013
0.777
+0.312
67.14%
jan 1, 2014
0.606
-0.17
-21.94%
jan 1, 2015
0.58
-0.026
-4.36%
jan 1, 2016
0.442
-0.138
-23.86%
Ranking of countries by current statistics by years


Comments: