29
/
en
AIzaSyAYiBZKx7MnpbEhh9jyipgxe19OcubqV5w
April 1, 2024
34420
Fragile and conflict affected situations
FCS
false
2
1
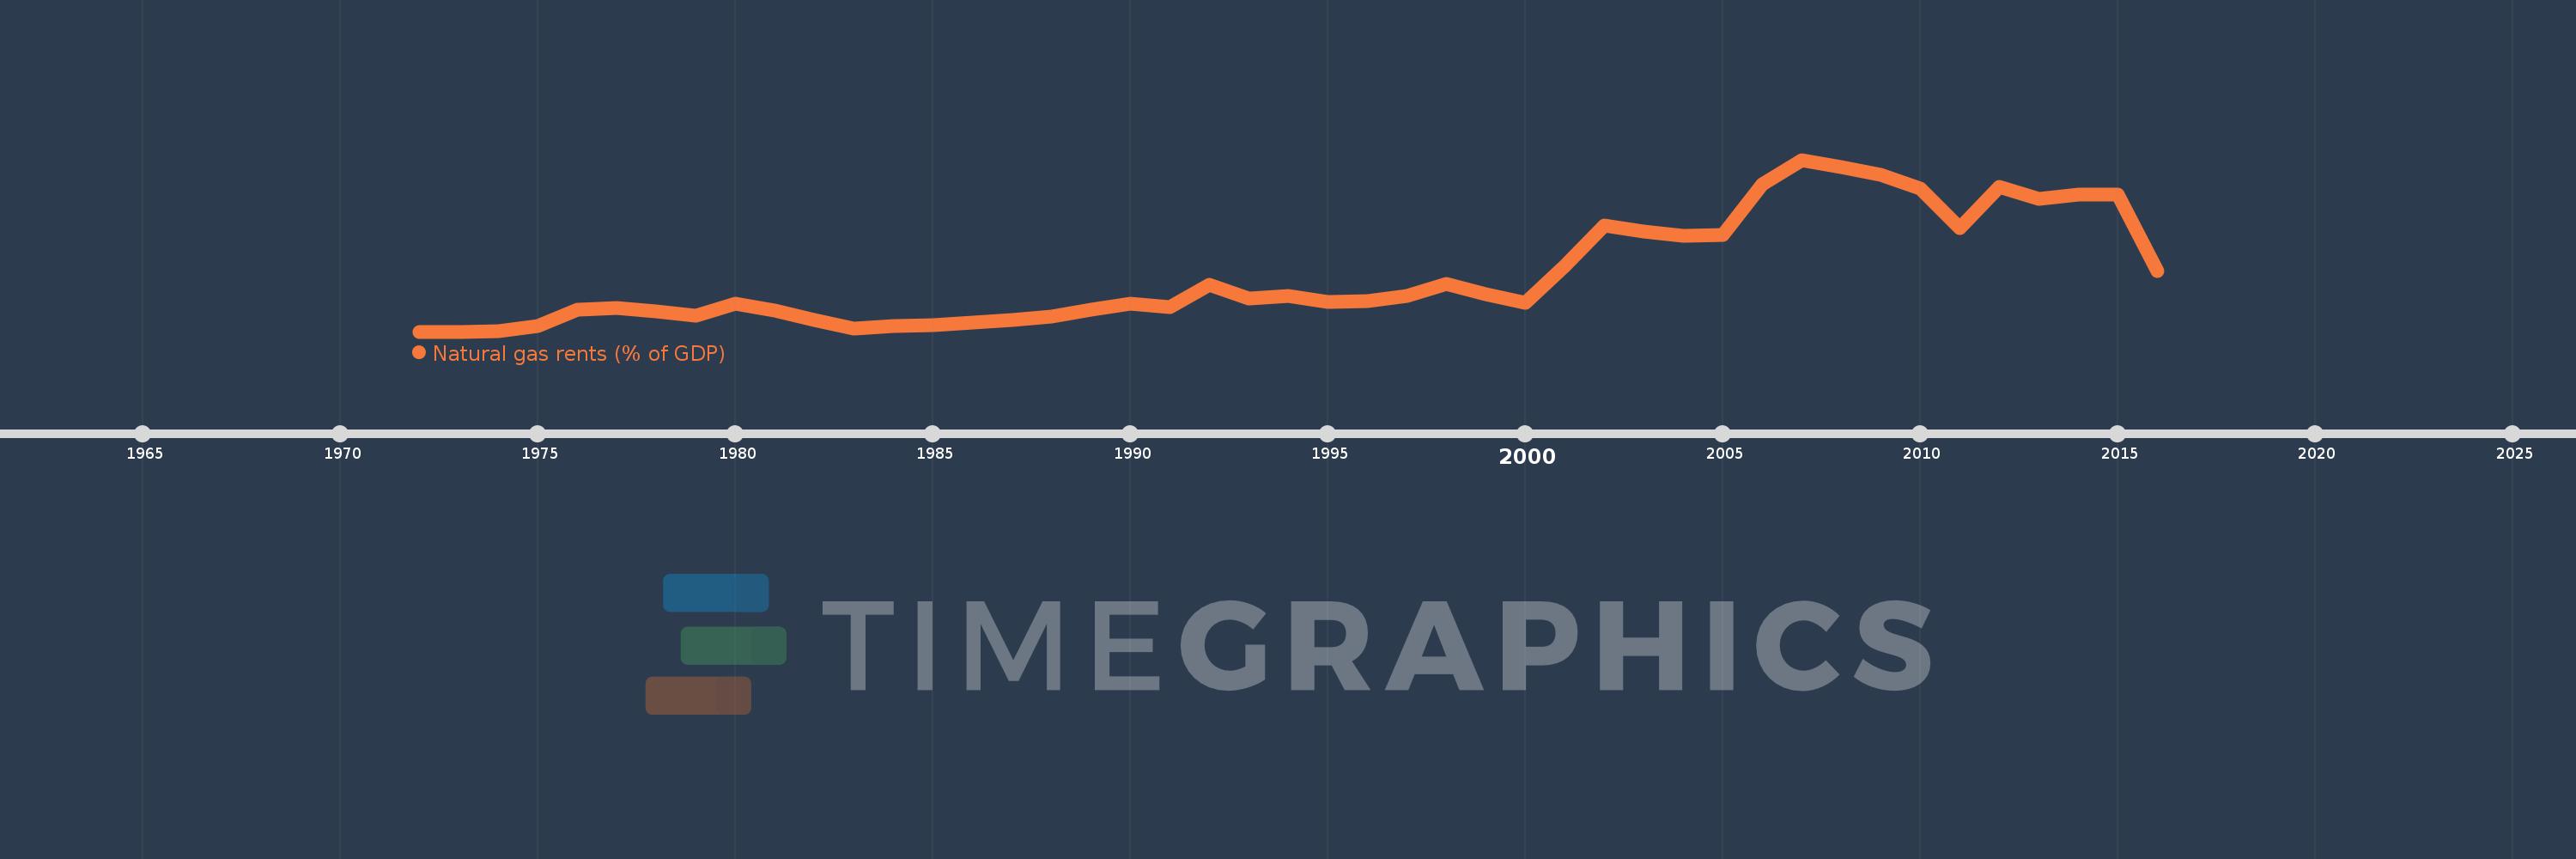
Natural gas rents (% of GDP)
2016,2015,2014,2013,2012,2011,2010,2009,2008,2007,2006,2005,2004,2003,2002,2001,2000,1999,1998,1997,1996,1995,1994,1993,1992,1991,1990,1989,1988,1987,1986,1985,1984,1983,1982,1981,1980,1979,1978,1977,1976,1975,1974,1973,1972
This statistics in other country:
Timeline:
This timeline shows a graph from 1972 to 2016 of Fragile and conflict affected situations. No data until 1971. Number of actual observations by date: 45.
Source name:
World Development Indicators
Source organization:
Estimates based on sources and methods described in "The Changing Wealth of Nations: Measuring Sustainable Development in the New Millennium" (World Bank, 2011).
Categories, topics:
Energy & Mining, Environment
Last updated:
apr 23, 2017
Indicators value changes by year
At the date of observation
Value
Absolute change
Change from previous value
jan 1, 1973
0.0
+0.0
23.61%
jan 1, 1974
0.001
+0.0
223.17%
jan 1, 1975
0.014
+0.014
2.36K%
jan 1, 1976
0.057
+0.043
304.12%
jan 1, 1977
0.062
+0.005
9.56%
jan 1, 1978
0.052
-0.01
-16.7%
jan 1, 1979
0.04
-0.012
-23.32%
jan 1, 1980
0.073
+0.033
82.77%
jan 1, 1981
0.055
-0.018
-24.79%
jan 1, 1982
0.031
-0.024
-44.22%
jan 1, 1983
0.008
-0.022
-73.3%
jan 1, 1984
0.015
+0.007
82.14%
jan 1, 1985
0.016
+0.001
5.67%
jan 1, 1986
0.023
+0.007
47.48%
jan 1, 1987
0.031
+0.008
33.73%
jan 1, 1988
0.039
+0.008
26.87%
jan 1, 1989
0.056
+0.017
43.54%
jan 1, 1990
0.073
+0.017
30.38%
jan 1, 1991
0.063
-0.01
-13.62%
jan 1, 1992
0.12
+0.056
88.68%
jan 1, 1993
0.086
-0.033
-27.9%
jan 1, 1994
0.093
+0.007
7.86%
jan 1, 1995
0.077
-0.016
-17.23%
jan 1, 1996
0.079
+0.002
2.58%
jan 1, 1997
0.093
+0.014
18.03%
jan 1, 1998
0.124
+0.031
33.01%
jan 1, 1999
0.096
-0.028
-22.61%
jan 1, 2000
0.075
-0.021
-22.09%
jan 1, 2001
0.17
+0.095
127.64%
jan 1, 2002
0.275
+0.105
61.81%
jan 1, 2003
0.258
-0.018
-6.53%
jan 1, 2004
0.248
-0.01
-3.78%
jan 1, 2005
0.249
+0.001
0.35%
jan 1, 2006
0.381
+0.133
53.34%
jan 1, 2007
0.444
+0.063
16.47%
jan 1, 2008
0.426
-0.018
-4.11%
jan 1, 2009
0.406
-0.02
-4.63%
jan 1, 2010
0.369
-0.037
-9.06%
jan 1, 2011
0.267
-0.102
-27.73%
jan 1, 2012
0.373
+0.106
39.56%
jan 1, 2013
0.343
-0.029
-7.83%
jan 1, 2014
0.353
+0.01
2.95%
jan 1, 2015
0.355
+0.001
0.29%
jan 1, 2016
0.157
-0.197
-55.61%
Ranking of countries by current statistics by years


Comments: