29
/
en
AIzaSyAYiBZKx7MnpbEhh9jyipgxe19OcubqV5w
April 1, 2024
119196
Denmark
DNK
true
2
1
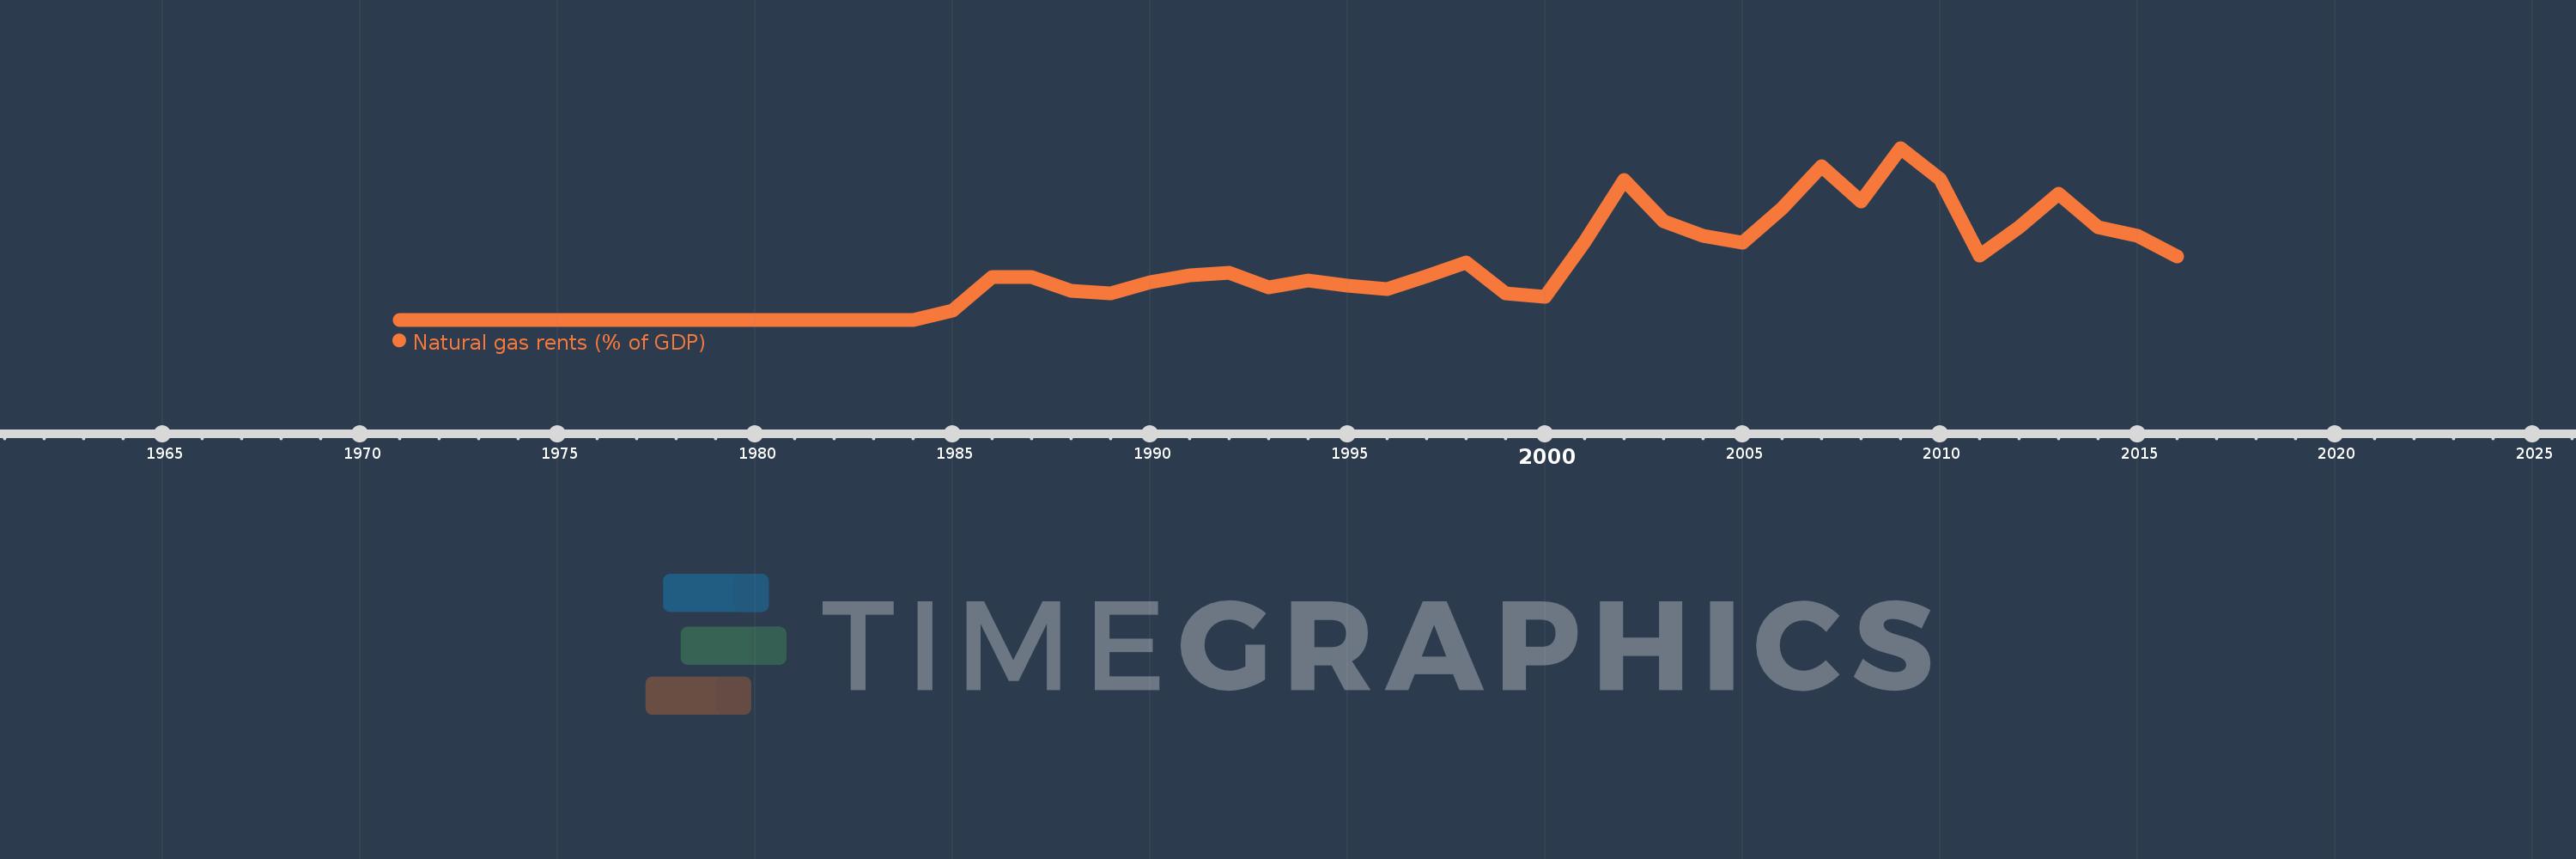
Natural gas rents (% of GDP)
2016,2015,2014,2013,2012,2011,2010,2009,2008,2007,2006,2005,2004,2003,2002,2001,2000,1999,1998,1997,1996,1995,1994,1993,1992,1991,1990,1989,1988,1987,1986,1985,1984,1983,1982,1981,1980,1979,1978,1977,1976,1975,1974,1973,1972,1971
This statistics in other country:
Timeline:
This timeline shows a graph from 1971 to 2016 of Denmark. No data until 1970. Number of actual observations by date: 46.
Source name:
World Development Indicators
Source organization:
Estimates based on sources and methods described in "The Changing Wealth of Nations: Measuring Sustainable Development in the New Millennium" (World Bank, 2011).
Categories, topics:
Energy & Mining, Environment
Last updated:
apr 23, 2017
Indicators value changes by year
At the date of observation
Value
Absolute change
Change from previous value
jan 1, 1985
0.017
+0.017
%
jan 1, 1986
0.08
+0.063
379.79%
jan 1, 1987
0.08
-0.001
-0.67%
jan 1, 1988
0.054
-0.026
-32.08%
jan 1, 1989
0.05
-0.004
-7.06%
jan 1, 1990
0.071
+0.021
41.24%
jan 1, 1991
0.083
+0.012
16.33%
jan 1, 1992
0.088
+0.006
6.99%
jan 1, 1993
0.061
-0.027
-30.91%
jan 1, 1994
0.073
+0.012
19.97%
jan 1, 1995
0.064
-0.009
-12.43%
jan 1, 1996
0.058
-0.006
-9.26%
jan 1, 1997
0.082
+0.024
41.3%
jan 1, 1998
0.108
+0.026
31.03%
jan 1, 1999
0.05
-0.058
-53.62%
jan 1, 2000
0.043
-0.007
-13.75%
jan 1, 2001
0.146
+0.103
239.77%
jan 1, 2002
0.262
+0.116
79.01%
jan 1, 2003
0.184
-0.079
-29.99%
jan 1, 2004
0.158
-0.025
-13.85%
jan 1, 2005
0.145
-0.013
-8.07%
jan 1, 2006
0.209
+0.064
43.87%
jan 1, 2007
0.288
+0.079
37.77%
jan 1, 2008
0.221
-0.067
-23.34%
jan 1, 2009
0.322
+0.101
45.78%
jan 1, 2010
0.263
-0.059
-18.42%
jan 1, 2011
0.12
-0.142
-54.14%
jan 1, 2012
0.173
+0.052
43.36%
jan 1, 2013
0.236
+0.063
36.41%
jan 1, 2014
0.174
-0.062
-26.28%
jan 1, 2015
0.158
-0.015
-8.84%
jan 1, 2016
0.119
-0.04
-25.08%
Ranking of countries by current statistics by years


Comments: