29
/
en
AIzaSyAYiBZKx7MnpbEhh9jyipgxe19OcubqV5w
April 1, 2024
109980
Congo, Dem. Rep.
COD
true
2
1
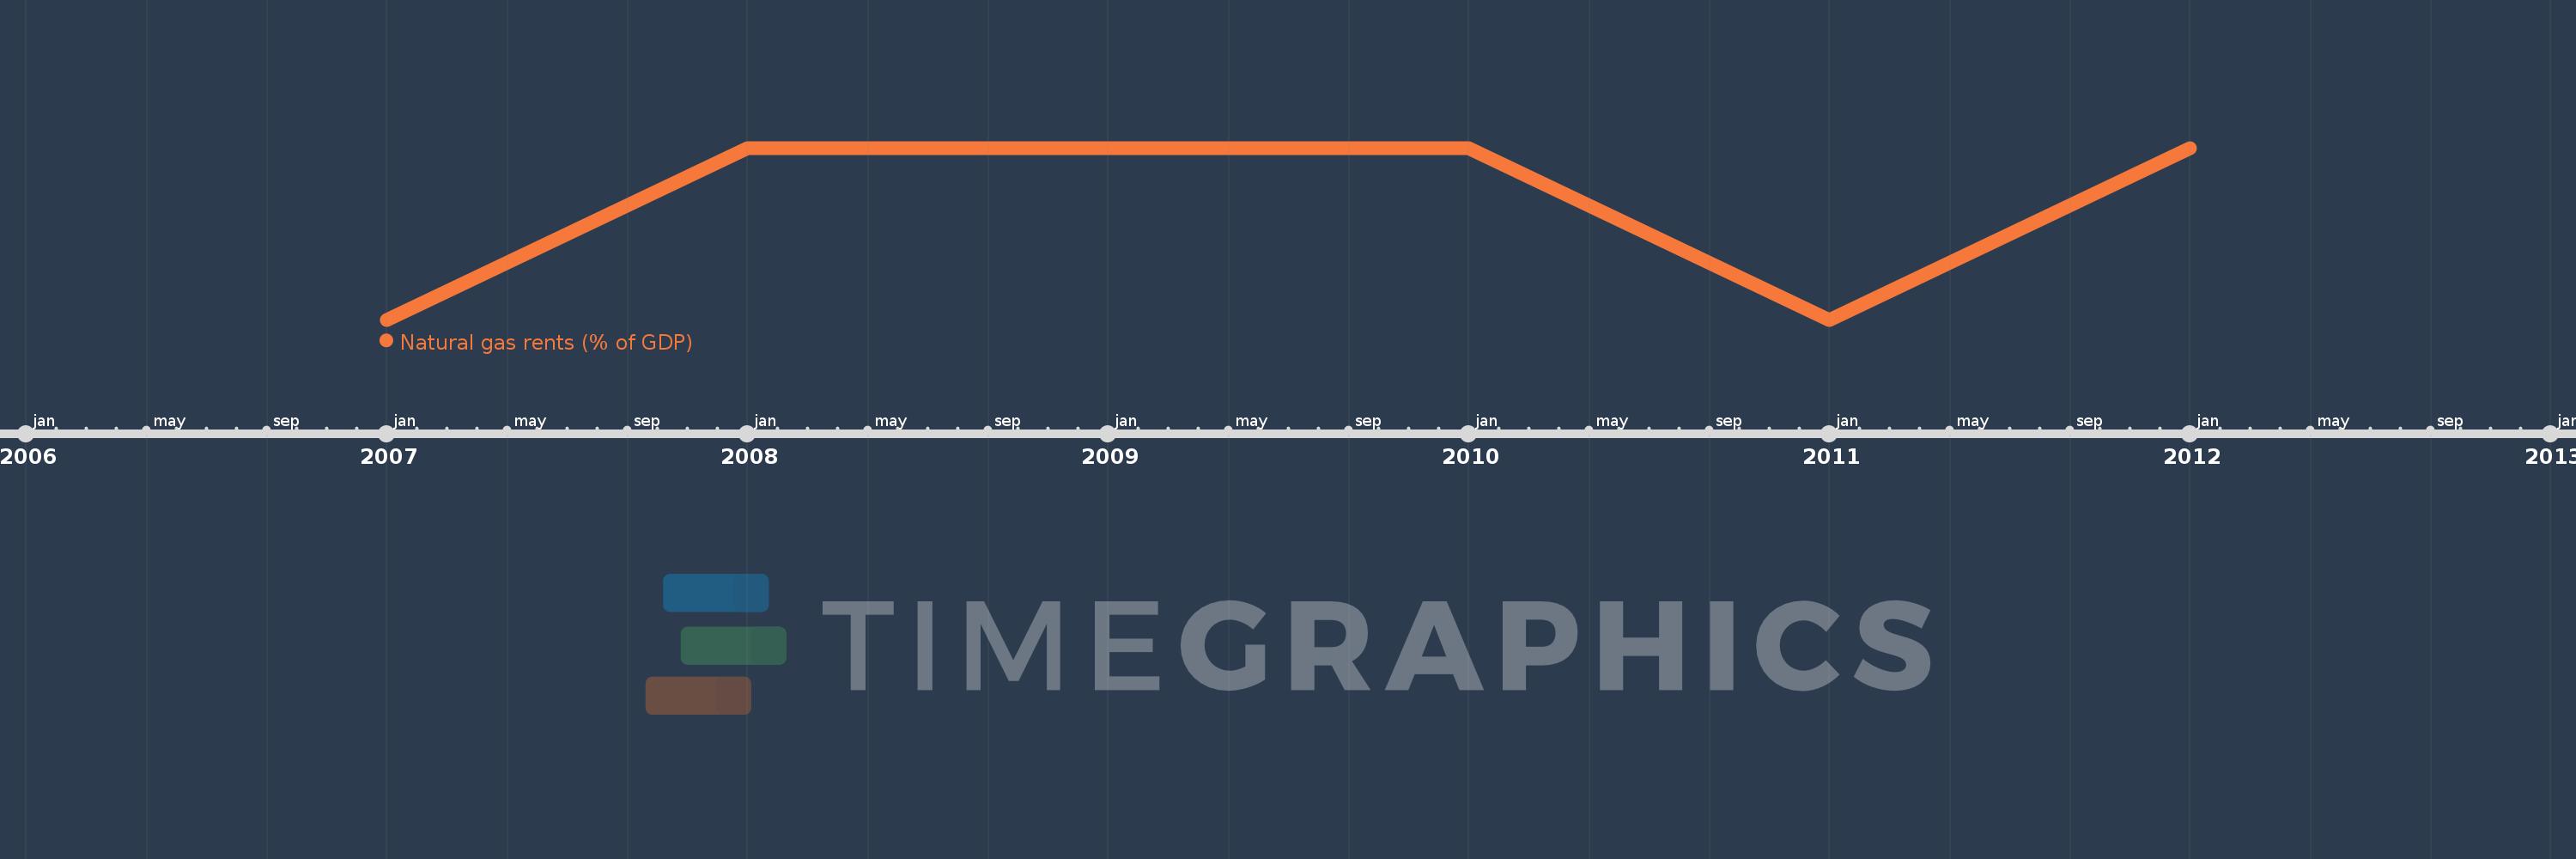
Natural gas rents (% of GDP)
2012,2011,2010,2009,2008,2007
This statistics in other country:
Timeline:
This timeline shows a graph from 2007 to 2012 of Congo, Dem. Rep.. No data until 2006. Number of actual observations by date: 6.
Source name:
World Development Indicators
Source organization:
Estimates based on sources and methods described in "The Changing Wealth of Nations: Measuring Sustainable Development in the New Millennium" (World Bank, 2011).
Categories, topics:
Energy & Mining, Environment
Last updated:
apr 23, 2017
Indicators value changes by year
At the date of observation
Value
Absolute change
Change from previous value
jan 1, 2007
0.001
+0.001
0.0%
jan 1, 2008
0.002
+0.001
200.36%
jan 1, 2009
0.002
+0.0
16.12%
jan 1, 2010
0.002
-0.001
-22.69%
jan 1, 2011
0.001
-0.001
-30.64%
jan 1, 2012
0.002
+0.001
44.69%
Ranking of countries by current statistics by years


Comments: