29
/
en
AIzaSyAYiBZKx7MnpbEhh9jyipgxe19OcubqV5w
April 1, 2024
127585
Equatorial Guinea
GNQ
true
2
1
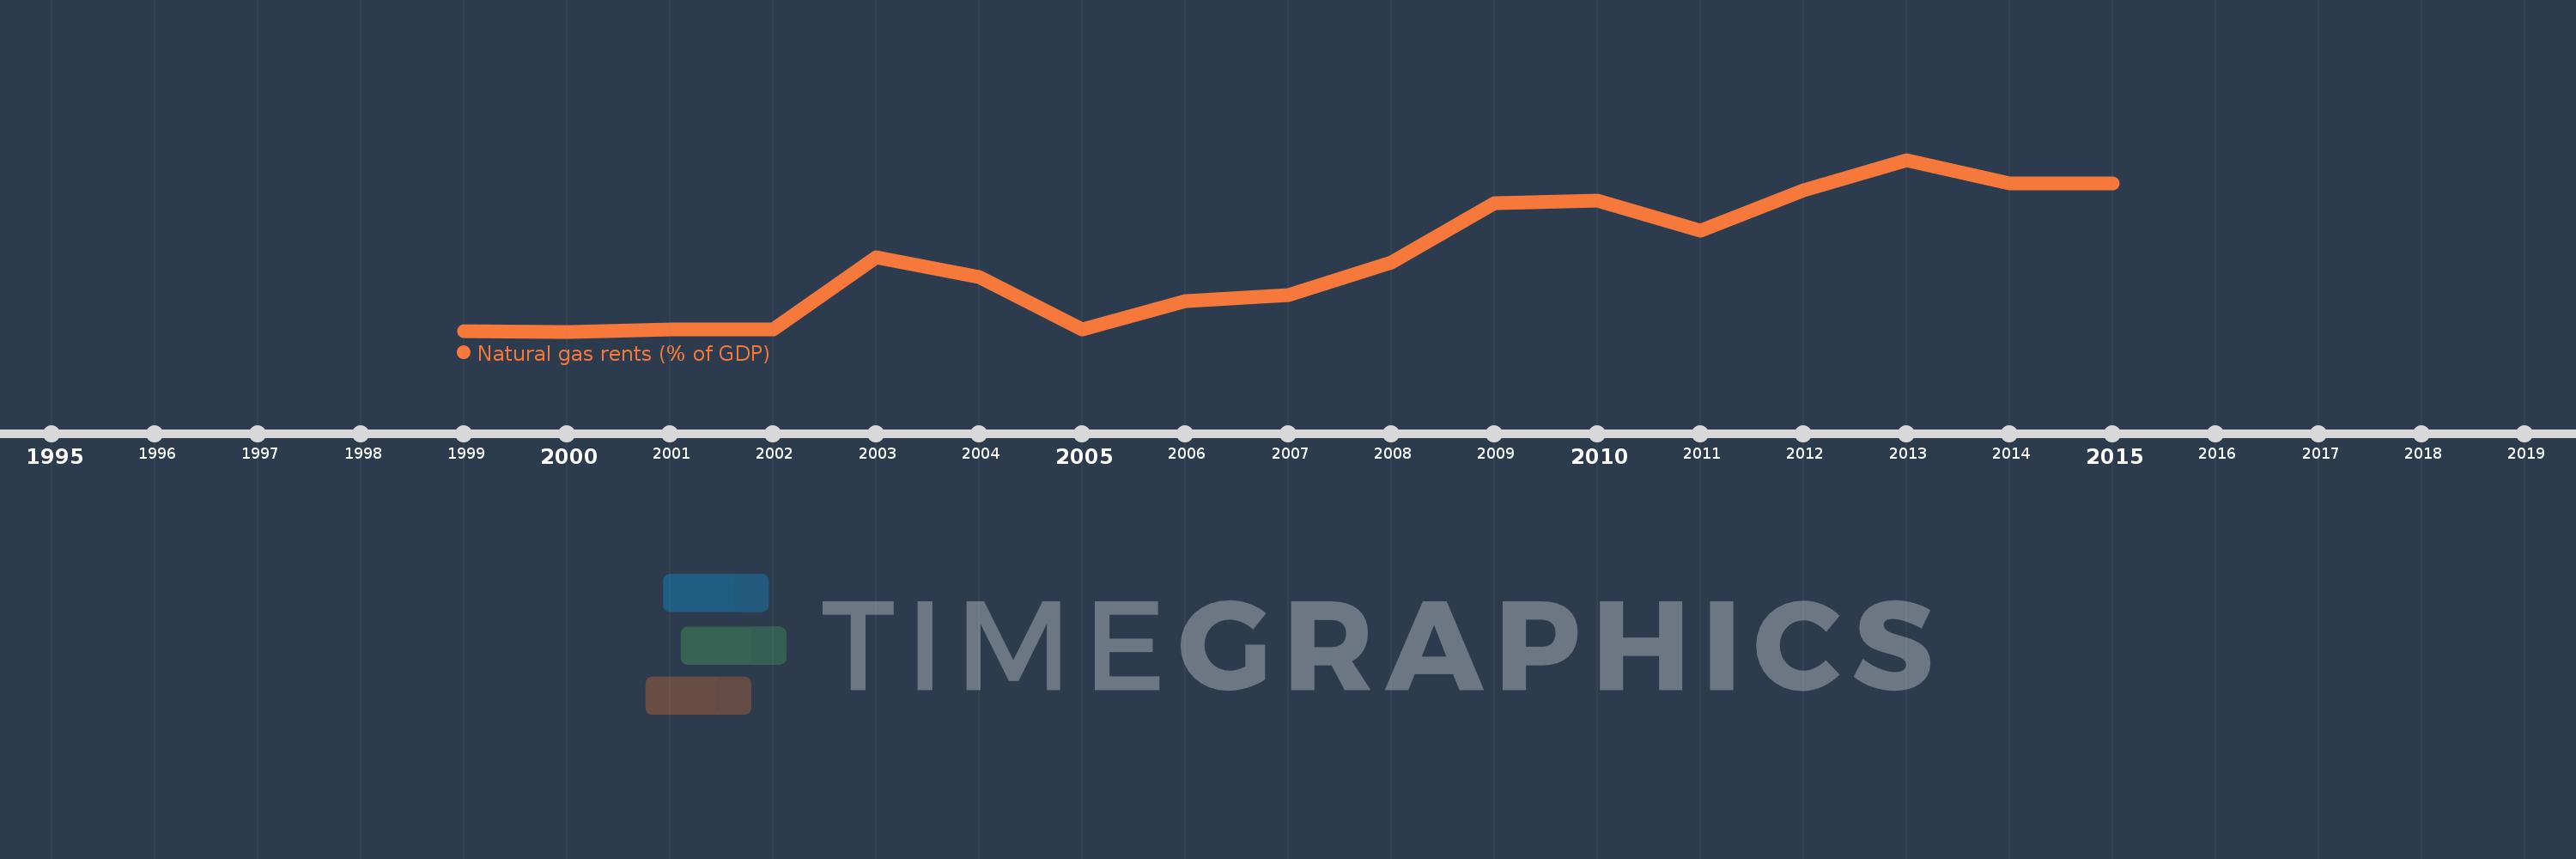
Natural gas rents (% of GDP)
2015,2014,2013,2012,2011,2010,2009,2008,2007,2006,2005,2004,2003,2002,2001,2000,1999
This statistics in other country:
Timeline:
This timeline shows a graph from 1999 to 2015 of Equatorial Guinea. No data until 1998. Number of actual observations by date: 17.
Source name:
World Development Indicators
Source organization:
Estimates based on sources and methods described in "The Changing Wealth of Nations: Measuring Sustainable Development in the New Millennium" (World Bank, 2011).
Categories, topics:
Energy & Mining, Environment
Last updated:
apr 23, 2017
Indicators value changes by year
At the date of observation
Value
Absolute change
Change from previous value
jan 1, 1999
0.019
+0.019
0.0%
jan 1, 2000
0.012
-0.007
-39.29%
jan 1, 2001
0.035
+0.023
201.7%
jan 1, 2002
0.032
-0.003
-9.02%
jan 1, 2003
0.87
+0.838
2.64K%
jan 1, 2004
0.64
-0.231
-26.5%
jan 1, 2005
0.033
-0.606
-94.82%
jan 1, 2006
0.361
+0.328
991.81%
jan 1, 2007
0.436
+0.075
20.74%
jan 1, 2008
0.815
+0.379
86.89%
jan 1, 2009
1.5
+0.684
83.91%
jan 1, 2010
1.525
+0.025
1.67%
jan 1, 2011
1.18
-0.345
-22.6%
jan 1, 2012
1.64
+0.46
38.98%
jan 1, 2013
1.996
+0.356
21.71%
jan 1, 2014
1.726
-0.27
-13.54%
jan 1, 2015
1.728
+0.003
0.15%
Ranking of countries by current statistics by years


Comments: