29
/
en
AIzaSyAYiBZKx7MnpbEhh9jyipgxe19OcubqV5w
April 1, 2024
158695
Iraq
IRQ
true
2
1
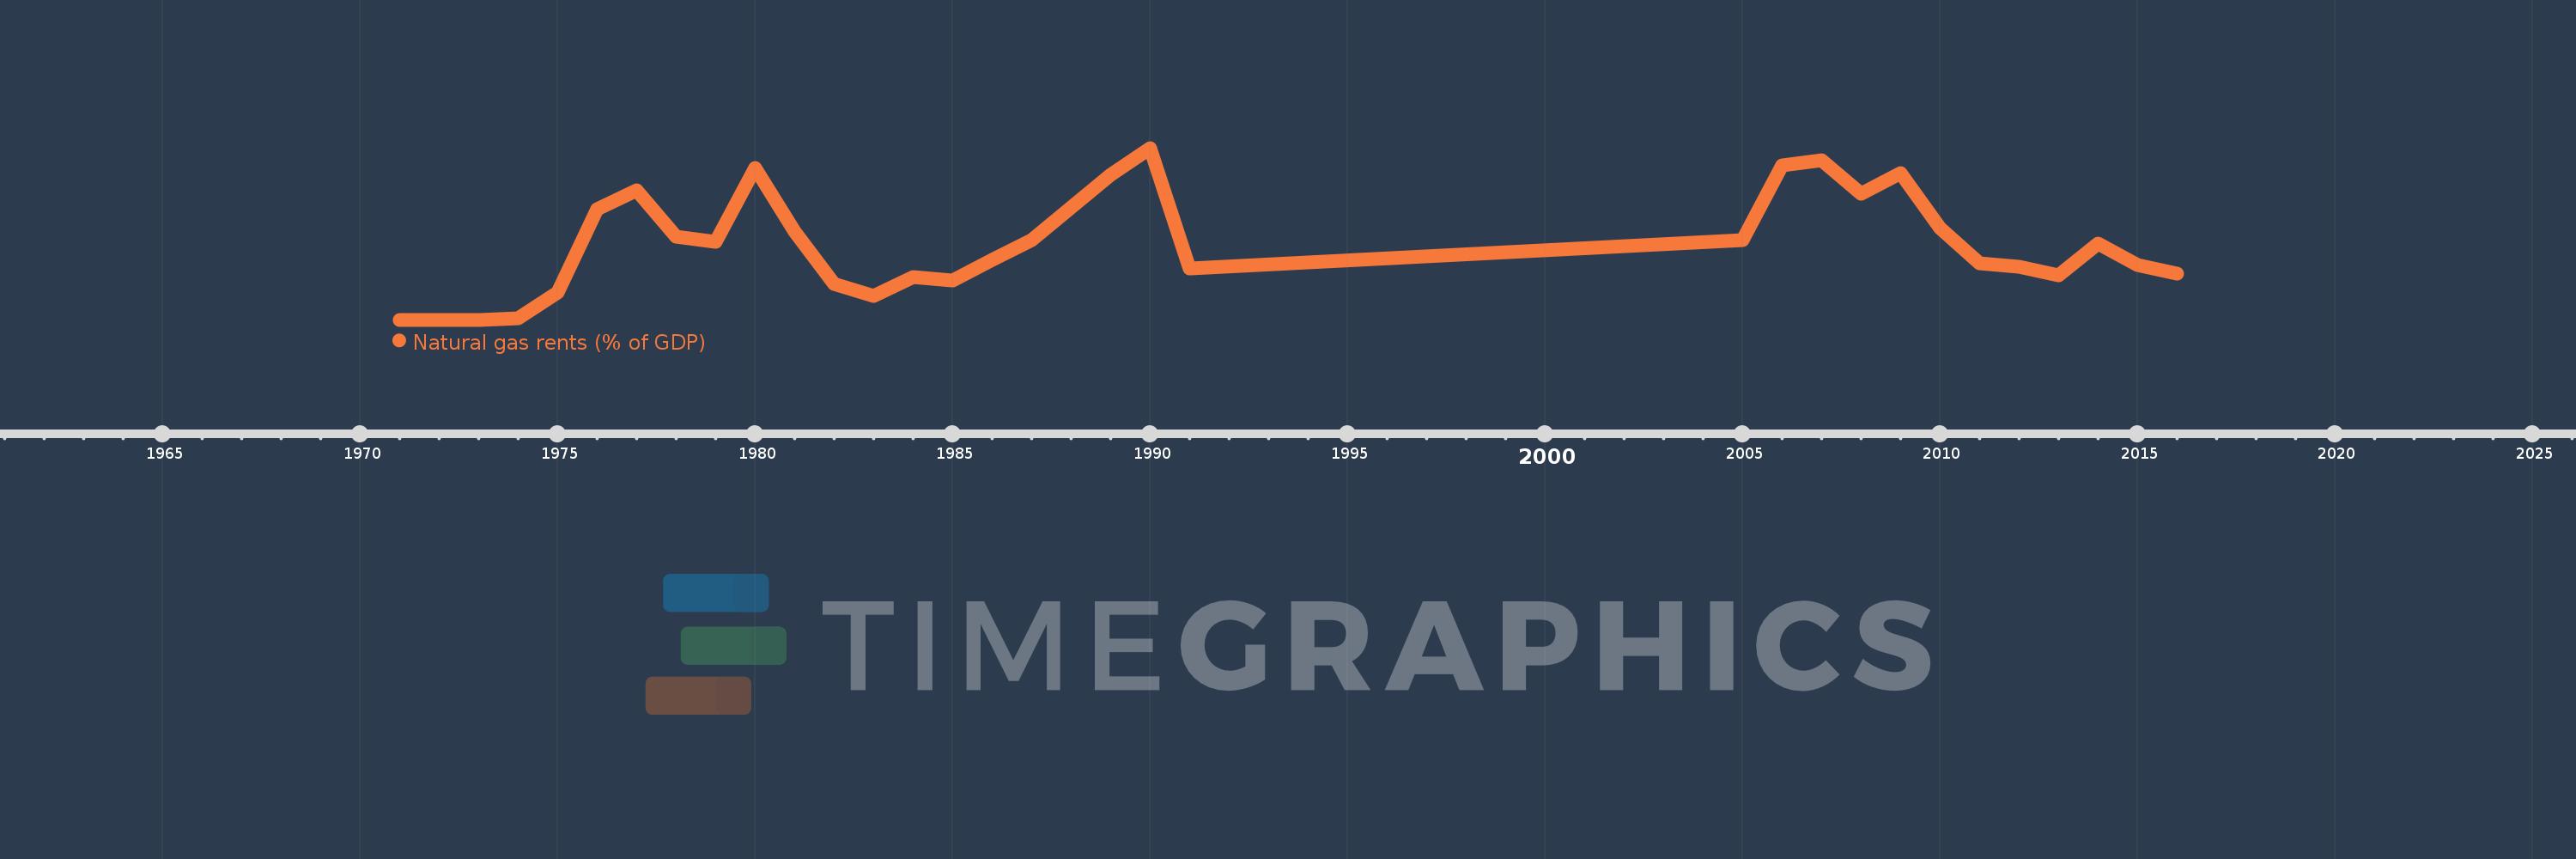
Natural gas rents (% of GDP)
2016,2015,2014,2013,2012,2011,2010,2009,2008,2007,2006,2005,1991,1990,1989,1988,1987,1986,1985,1984,1983,1982,1981,1980,1979,1978,1977,1976,1975,1974,1973,1972,1971
This statistics in other country:
Timeline:
This timeline shows a graph from 1971 to 2016 of Iraq. No data until 1970. Number of actual observations by date: 33.
Source name:
World Development Indicators
Source organization:
Estimates based on sources and methods described in "The Changing Wealth of Nations: Measuring Sustainable Development in the New Millennium" (World Bank, 2011).
Categories, topics:
Energy & Mining, Environment
Last updated:
apr 23, 2017
Indicators value changes by year
At the date of observation
Value
Absolute change
Change from previous value
jan 1, 1971
0.001
+0.001
0.0%
jan 1, 1972
0.001
+0.0
0.16%
jan 1, 1973
0.001
+0.0
27.94%
jan 1, 1974
0.002
+0.002
212.08%
jan 1, 1975
0.017
+0.015
677.58%
jan 1, 1976
0.066
+0.049
284.24%
jan 1, 1977
0.077
+0.011
16.44%
jan 1, 1978
0.05
-0.027
-35.61%
jan 1, 1979
0.047
-0.003
-5.74%
jan 1, 1980
0.09
+0.043
91.46%
jan 1, 1981
0.053
-0.037
-41.1%
jan 1, 1982
0.022
-0.03
-57.55%
jan 1, 1983
0.015
-0.007
-32.53%
jan 1, 1984
0.026
+0.01
69.29%
jan 1, 1985
0.024
-0.002
-6.15%
jan 1, 1986
0.036
+0.012
52.04%
jan 1, 1987
0.048
+0.012
32.21%
jan 1, 1988
0.067
+0.018
37.97%
jan 1, 1989
0.086
+0.019
28.97%
jan 1, 1990
0.102
+0.016
18.82%
jan 1, 1991
0.031
-0.071
-69.5%
jan 1, 2005
0.048
+0.017
55.29%
jan 1, 2006
0.092
+0.044
91.42%
jan 1, 2007
0.095
+0.003
2.8%
jan 1, 2008
0.075
-0.02
-20.72%
jan 1, 2009
0.087
+0.012
15.81%
jan 1, 2010
0.055
-0.032
-36.71%
jan 1, 2011
0.034
-0.021
-37.58%
jan 1, 2012
0.032
-0.002
-6.89%
jan 1, 2013
0.027
-0.005
-15.37%
jan 1, 2014
0.046
+0.019
70.49%
jan 1, 2015
0.033
-0.014
-29.69%
jan 1, 2016
0.028
-0.004
-13.62%
Ranking of countries by current statistics by years


Comments: