29
/
en
AIzaSyAYiBZKx7MnpbEhh9jyipgxe19OcubqV5w
April 1, 2024
262586
Thailand
THA
true
2
1
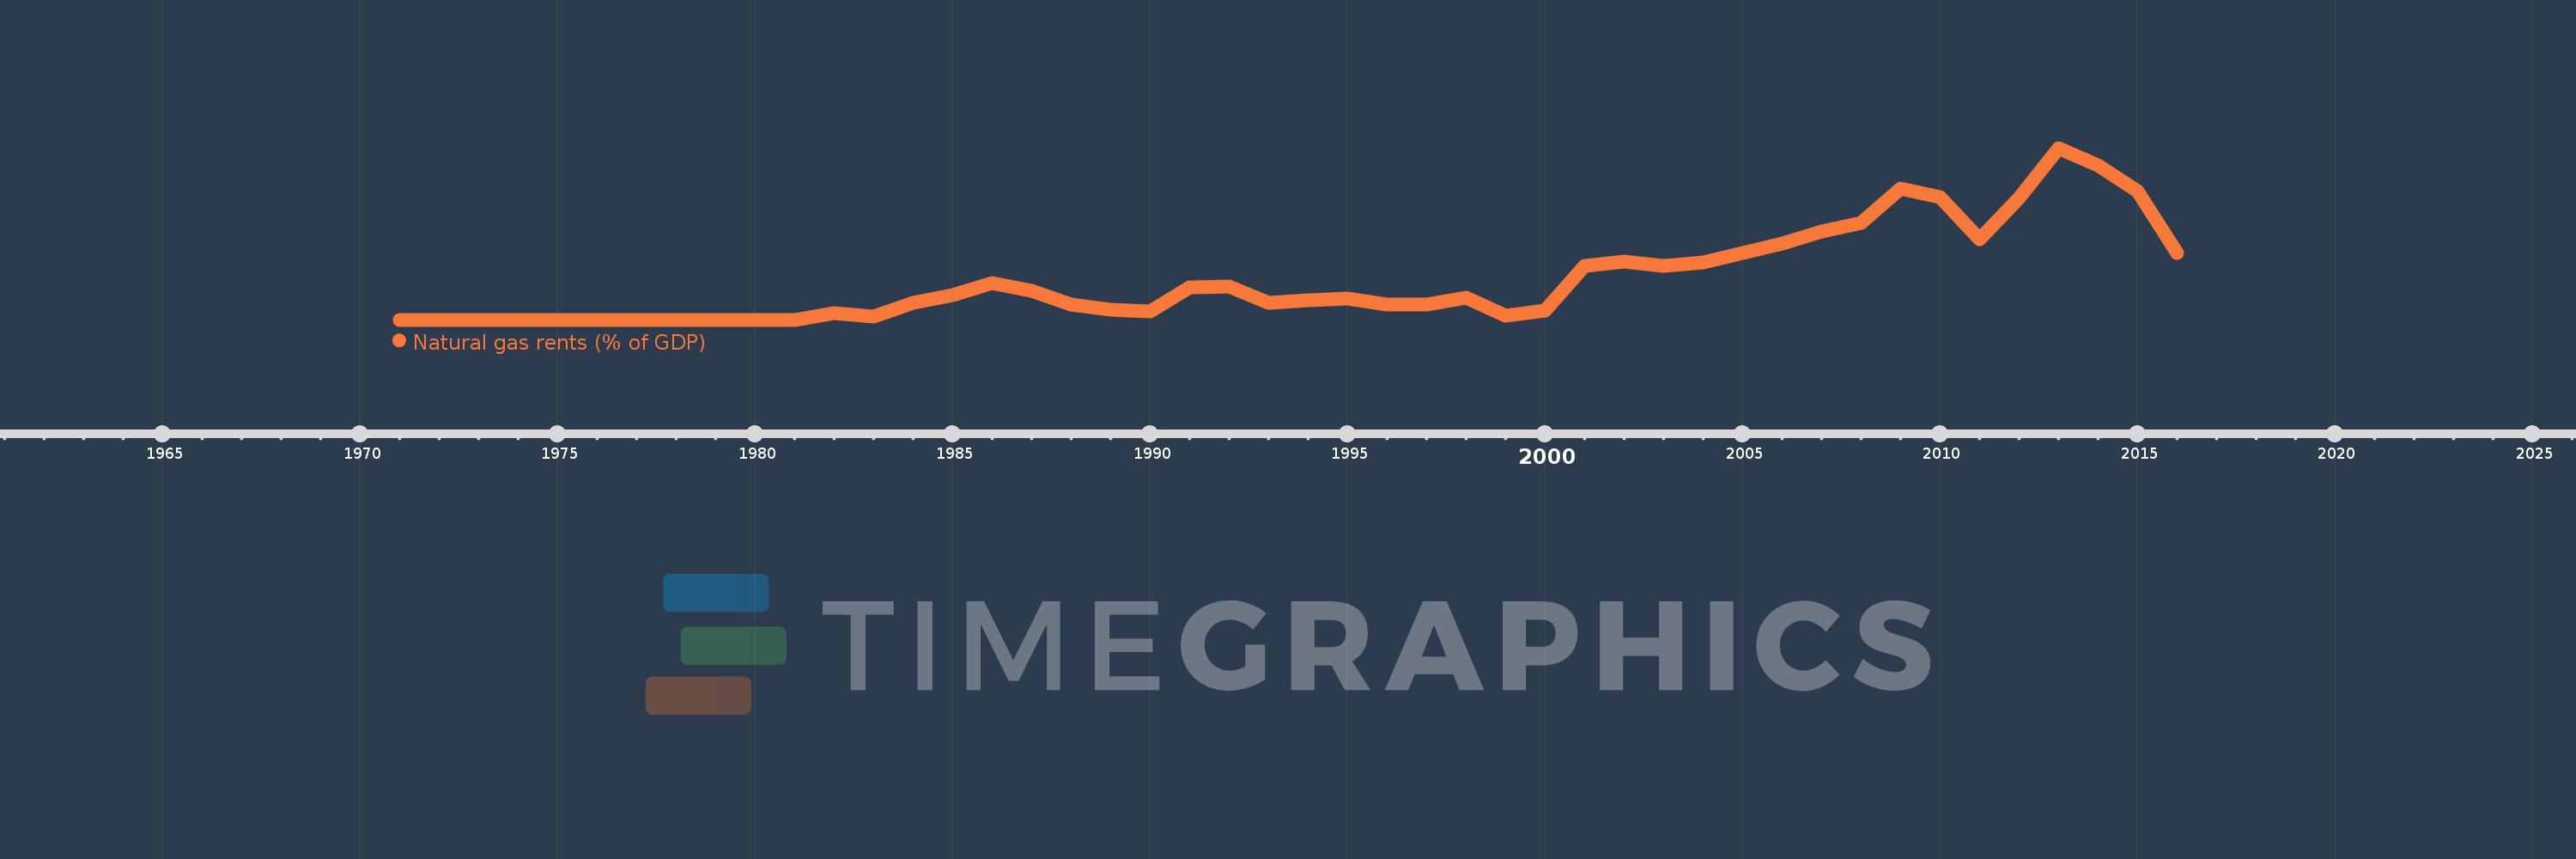
Natural gas rents (% of GDP)
2016,2015,2014,2013,2012,2011,2010,2009,2008,2007,2006,2005,2004,2003,2002,2001,2000,1999,1998,1997,1996,1995,1994,1993,1992,1991,1990,1989,1988,1987,1986,1985,1984,1983,1982,1981,1980,1979,1978,1977,1976,1975,1974,1973,1972,1971
This statistics in other country:
Timeline:
This timeline shows a graph from 1971 to 2016 of Thailand. No data until 1970. Number of actual observations by date: 46.
Source name:
World Development Indicators
Source organization:
Estimates based on sources and methods described in "The Changing Wealth of Nations: Measuring Sustainable Development in the New Millennium" (World Bank, 2011).
Categories, topics:
Energy & Mining, Environment
Last updated:
apr 23, 2017
Indicators value changes by year
At the date of observation
Value
Absolute change
Change from previous value
jan 1, 1982
0.022
+0.022
%
jan 1, 1983
0.011
-0.01
-47.65%
jan 1, 1984
0.06
+0.048
429.04%
jan 1, 1985
0.087
+0.027
45.51%
jan 1, 1986
0.128
+0.041
46.79%
jan 1, 1987
0.103
-0.025
-19.24%
jan 1, 1988
0.052
-0.051
-49.24%
jan 1, 1989
0.035
-0.018
-33.57%
jan 1, 1990
0.029
-0.006
-16.24%
jan 1, 1991
0.113
+0.084
288.57%
jan 1, 1992
0.118
+0.005
4.13%
jan 1, 1993
0.06
-0.058
-49.17%
jan 1, 1994
0.068
+0.008
13.23%
jan 1, 1995
0.074
+0.006
9.24%
jan 1, 1996
0.053
-0.021
-28.31%
jan 1, 1997
0.053
+0.0
0.62%
jan 1, 1998
0.077
+0.023
43.88%
jan 1, 1999
0.014
-0.063
-81.73%
jan 1, 2000
0.031
+0.017
119.09%
jan 1, 2001
0.188
+0.157
511.42%
jan 1, 2002
0.203
+0.015
7.89%
jan 1, 2003
0.189
-0.014
-6.67%
jan 1, 2004
0.202
+0.013
6.81%
jan 1, 2005
0.233
+0.031
15.27%
jan 1, 2006
0.268
+0.035
14.92%
jan 1, 2007
0.31
+0.042
15.66%
jan 1, 2008
0.34
+0.03
9.64%
jan 1, 2009
0.46
+0.12
35.43%
jan 1, 2010
0.43
-0.03
-6.52%
jan 1, 2011
0.282
-0.148
-34.48%
jan 1, 2012
0.428
+0.146
51.99%
jan 1, 2013
0.603
+0.175
40.87%
jan 1, 2014
0.541
-0.062
-10.36%
jan 1, 2015
0.45
-0.091
-16.83%
jan 1, 2016
0.233
-0.217
-48.2%
Ranking of countries by current statistics by years


Comments: