29
/
en
AIzaSyAYiBZKx7MnpbEhh9jyipgxe19OcubqV5w
April 1, 2024
115105
Croatia
HRV
true
2
1
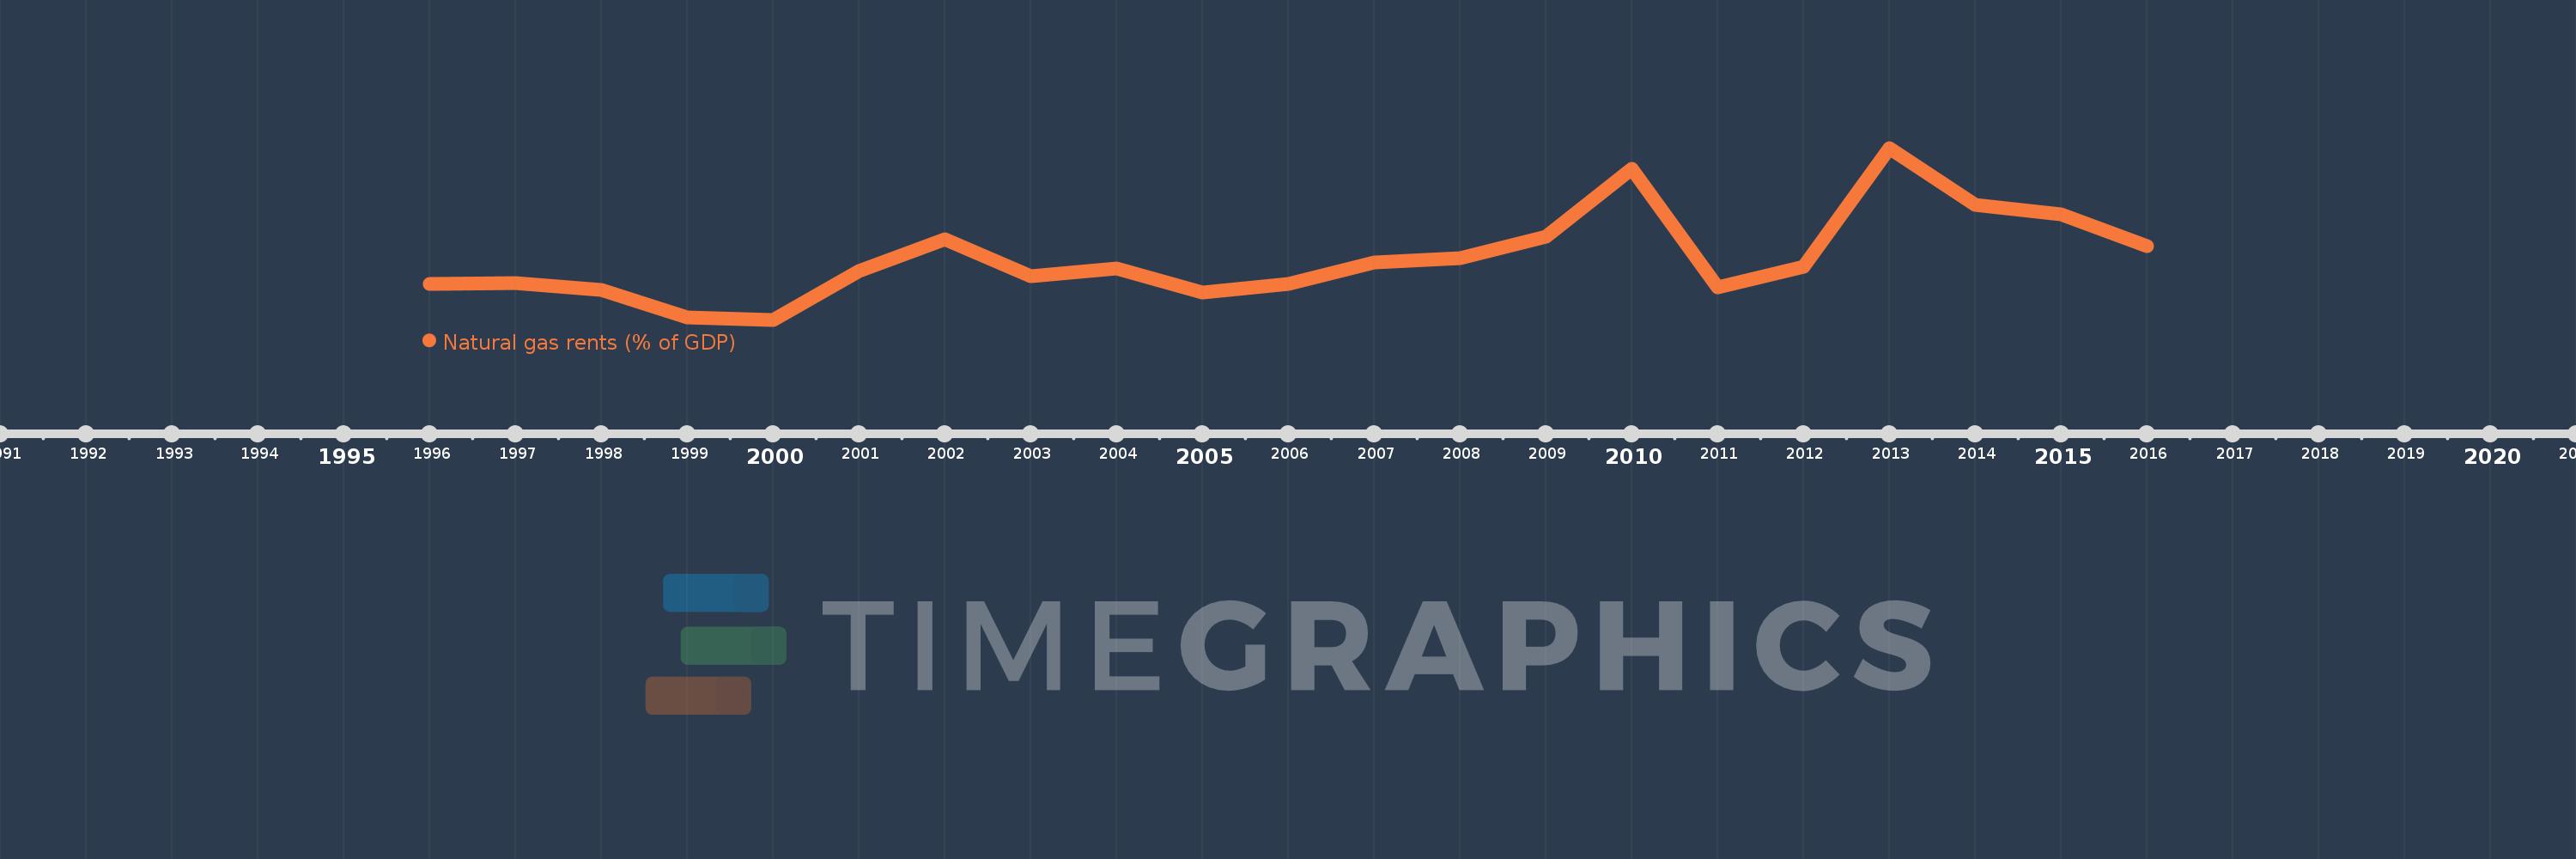
Natural gas rents (% of GDP)
2016,2015,2014,2013,2012,2011,2010,2009,2008,2007,2006,2005,2004,2003,2002,2001,2000,1999,1998,1997,1996
This statistics in other country:
Timeline:
This timeline shows a graph from 1996 to 2016 of Croatia. No data until 1995. Number of actual observations by date: 21.
Source name:
World Development Indicators
Source organization:
Estimates based on sources and methods described in "The Changing Wealth of Nations: Measuring Sustainable Development in the New Millennium" (World Bank, 2011).
Categories, topics:
Energy & Mining, Environment
Last updated:
apr 23, 2017
Indicators value changes by year
At the date of observation
Value
Absolute change
Change from previous value
jan 1, 1996
0.16
+0.16
0.0%
jan 1, 1997
0.164
+0.004
2.43%
jan 1, 1998
0.144
-0.021
-12.51%
jan 1, 1999
0.065
-0.079
-54.95%
jan 1, 2000
0.059
-0.005
-8.16%
jan 1, 2001
0.197
+0.137
230.92%
jan 1, 2002
0.287
+0.09
45.91%
jan 1, 2003
0.183
-0.104
-36.16%
jan 1, 2004
0.204
+0.021
11.19%
jan 1, 2005
0.136
-0.068
-33.49%
jan 1, 2006
0.162
+0.026
19.24%
jan 1, 2007
0.222
+0.06
37.09%
jan 1, 2008
0.235
+0.014
6.13%
jan 1, 2009
0.295
+0.059
25.26%
jan 1, 2010
0.488
+0.193
65.49%
jan 1, 2011
0.151
-0.337
-69.13%
jan 1, 2012
0.21
+0.06
39.59%
jan 1, 2013
0.548
+0.337
160.57%
jan 1, 2014
0.385
-0.163
-29.78%
jan 1, 2015
0.36
-0.025
-6.45%
jan 1, 2016
0.269
-0.09
-25.11%
Ranking of countries by current statistics by years


Comments: