29
/
en
AIzaSyAYiBZKx7MnpbEhh9jyipgxe19OcubqV5w
April 1, 2024
73978
Austria
AUT
true
2
1
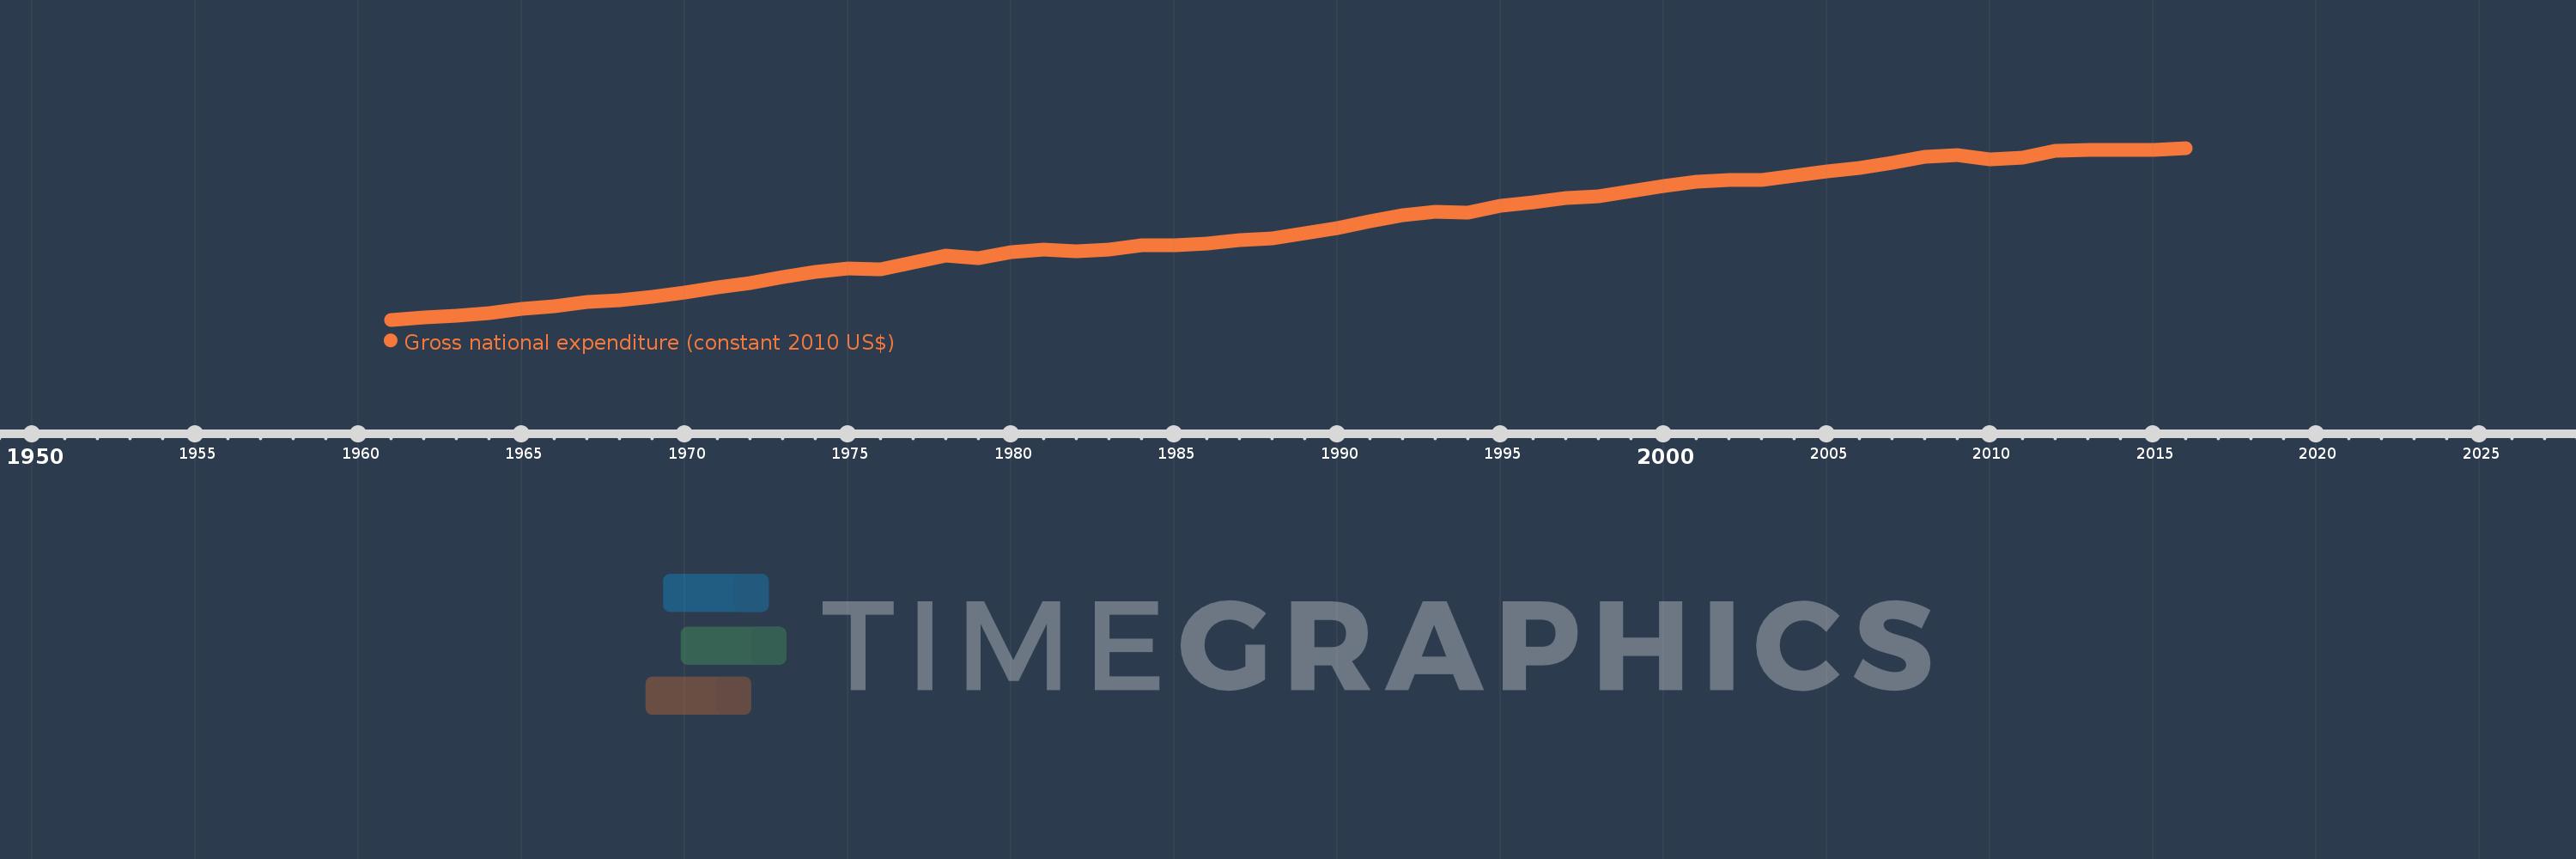
Gross national expenditure (constant 2010 US$)
2016,2015,2014,2013,2012,2011,2010,2009,2008,2007,2006,2005,2004,2003,2002,2001,2000,1999,1998,1997,1996,1995,1994,1993,1992,1991,1990,1989,1988,1987,1986,1985,1984,1983,1982,1981,1980,1979,1978,1977,1976,1975,1974,1973,1972,1971,1970,1969,1968,1967,1966,1965,1964,1963,1962,1961
This statistics in other country:
AfghanistanAlbaniaAlgeriaAngolaAntigua and BarbudaArab WorldArgentinaArmeniaArubaAustraliaAustriaAzerbaijanBahamas, TheBahrainBangladeshBarbadosBelarusBelgiumBelizeBeninBermudaBhutanBoliviaBosnia and HerzegovinaBotswanaBrazilBrunei DarussalamBulgariaBurkina FasoBurundiCabo VerdeCambodiaCameroonCanadaCaribbean small statesCentral African RepublicCentral Europe and the BalticsChadChileChinaColombiaComorosCongo, Dem. Rep.Congo, Rep.Costa RicaCote d'IvoireCroatiaCubaCyprusCzech RepublicDenmarkDominicaDominican RepublicEarly-demographic dividendEast Asia & PacificEast Asia & Pacific (excluding high income)East Asia & Pacific (IDA & IBRD countries)EcuadorEgypt, Arab Rep.El SalvadorEquatorial GuineaEritreaEstoniaEuro areaEurope & Central AsiaEurope & Central Asia (excluding high income)Europe & Central Asia (IDA & IBRD countries)European UnionFaroe IslandsFijiFinlandFragile and conflict affected situationsFranceGabonGambia, TheGeorgiaGermanyGhanaGreeceGrenadaGuatemalaGuineaGuinea-BissauGuyanaHaitiHeavily indebted poor countries (HIPC)High incomeHondurasHong Kong SAR, ChinaHungaryIBRD onlyIcelandIDA & IBRD totalIDA blendIDA onlyIDA totalIndiaIndonesiaIran, Islamic Rep.IraqIrelandIsraelItalyJamaicaJapanJordanKazakhstanKenyaKiribatiKorea, Rep.KosovoKuwaitKyrgyz RepublicLao PDRLate-demographic dividendLatin America & Caribbean Latin America & Caribbean (excluding high income)Latin America & the Caribbean (IDA & IBRD countries)LatviaLeast developed countries: UN classificationLebanonLiberiaLibyaLithuaniaLow & middle incomeLow incomeLower middle incomeLuxembourgMacao SAR, ChinaMacedonia, FYRMadagascarMalawiMalaysiaMaldivesMaliMaltaMauritaniaMauritiusMexicoMiddle East & North AfricaMiddle East & North Africa (excluding high income)Middle East & North Africa (IDA & IBRD countries)Middle incomeMoldovaMongoliaMontenegroMoroccoMozambiqueMyanmarNamibiaNepalNetherlandsNew ZealandNicaraguaNigerNigeriaNorth AmericaNorwayOECD membersOmanOther small statesPacific island small statesPakistanPalauPanamaParaguayPeruPhilippinesPolandPortugalPost-demographic dividendPre-demographic dividendPuerto RicoQatarRomaniaRussian FederationRwandaSamoaSaudi ArabiaSenegalSerbiaSeychellesSierra LeoneSingaporeSlovak RepublicSloveniaSmall statesSolomon IslandsSouth AfricaSouth AsiaSouth Asia (IDA & IBRD)South SudanSpainSri LankaSt. Kitts and NevisSt. LuciaSt. Vincent and the GrenadinesSub-Saharan Africa Sub-Saharan Africa (excluding high income)Sub-Saharan Africa (IDA & IBRD countries)SudanSurinameSwazilandSwedenSwitzerlandTajikistanTanzaniaThailandTimor-LesteTogoTongaTrinidad and TobagoTunisiaTurkeyTurkmenistanUgandaUkraineUnited Arab EmiratesUnited KingdomUnited StatesUpper middle incomeUruguayUzbekistanVanuatuVenezuela, RBVietnamWest Bank and GazaWorldYemen, Rep.ZambiaZimbabwe Timeline:
This timeline shows a graph from 1961 to 2016 of Austria. No data until 1960. Number of actual observations by date: 56.
Source name:
World Development Indicators
Source organization:
World Bank national accounts data, and OECD National Accounts data files.
Categories, topics:
Economy & Growth
Last updated:
apr 23, 2017
Indicators value changes by year
Minimum:
93.91 bln
jan 1, 1961
Maximum:
393.49 bln
jan 1, 2016
At the date of observation
Value
Absolute change
Change from previous value
jan 1, 1961
93.91 bln
+93.91 bln
0.0%
jan 1, 1962
98.603 bln
+4.693 bln
5.0%
jan 1, 1963
101.117 bln
+2.514 bln
2.55%
jan 1, 1964
105.891 bln
+4.774 bln
4.72%
jan 1, 1965
113.097 bln
+7.206 bln
6.81%
jan 1, 1966
117.685 bln
+4.587 bln
4.06%
jan 1, 1967
125.066 bln
+7.382 bln
6.27%
jan 1, 1968
128.194 bln
+3.128 bln
2.5%
jan 1, 1969
133.814 bln
+5.62 bln
4.38%
jan 1, 1970
140.655 bln
+6.841 bln
5.11%
jan 1, 1971
149.755 bln
+9.1 bln
6.47%
jan 1, 1972
157.432 bln
+7.677 bln
5.13%
jan 1, 1973
167.995 bln
+10.563 bln
6.71%
jan 1, 1974
177.675 bln
+9.68 bln
5.76%
jan 1, 1975
183.7 bln
+6.025 bln
3.39%
jan 1, 1976
181.984 bln
-1.716 bln
-0.93%
jan 1, 1977
193.134 bln
+11.15 bln
6.13%
jan 1, 1978
205.488 bln
+12.355 bln
6.4%
jan 1, 1979
201.233 bln
-4.256 bln
-2.07%
jan 1, 1980
211.926 bln
+10.693 bln
5.31%
jan 1, 1981
216.844 bln
+4.918 bln
2.32%
jan 1, 1982
213.847 bln
-2.996 bln
-1.38%
jan 1, 1983
215.997 bln
+2.15 bln
1.01%
jan 1, 1984
223.779 bln
+7.782 bln
3.6%
jan 1, 1985
223.424 bln
-355.283 mln
-0.16%
jan 1, 1986
227.276 bln
+3.852 bln
1.72%
jan 1, 1987
232.592 bln
+5.315 bln
2.34%
jan 1, 1988
236.08 bln
+3.489 bln
1.5%
jan 1, 1989
244.843 bln
+8.762 bln
3.71%
jan 1, 1990
254.456 bln
+9.613 bln
3.93%
jan 1, 1991
265.301 bln
+10.845 bln
4.26%
jan 1, 1992
276.226 bln
+10.926 bln
4.12%
jan 1, 1993
282.65 bln
+6.424 bln
2.33%
jan 1, 1994
281.084 bln
-1.566 bln
-0.55%
jan 1, 1995
291.97 bln
+10.887 bln
3.87%
jan 1, 1996
298.991 bln
+7.021 bln
2.4%
jan 1, 1997
305.897 bln
+6.906 bln
2.31%
jan 1, 1998
309.576 bln
+3.678 bln
1.2%
jan 1, 1999
318.546 bln
+8.97 bln
2.9%
jan 1, 2000
327.32 bln
+8.775 bln
2.75%
jan 1, 2001
334.501 bln
+7.181 bln
2.19%
jan 1, 2002
338.193 bln
+3.692 bln
1.1%
jan 1, 2003
338.347 bln
+153.51 mln
0.05%
jan 1, 2004
345.343 bln
+6.997 bln
2.07%
jan 1, 2005
353.319 bln
+7.976 bln
2.31%
jan 1, 2006
358.978 bln
+5.659 bln
1.6%
jan 1, 2007
368.048 bln
+9.071 bln
2.53%
jan 1, 2008
377.862 bln
+9.813 bln
2.67%
jan 1, 2009
381.101 bln
+3.24 bln
0.86%
jan 1, 2010
374.158 bln
-6.943 bln
-1.82%
jan 1, 2011
377.263 bln
+3.105 bln
0.83%
jan 1, 2012
387.875 bln
+10.611 bln
2.81%
jan 1, 2013
389.545 bln
+1.671 bln
0.43%
jan 1, 2014
390.193 bln
+647.695 mln
0.17%
jan 1, 2015
390.524 bln
+330.768 mln
0.08%
jan 1, 2016
393.49 bln
+2.967 bln
0.76%
Ranking of countries by current statistics by years


Comments: