29
/
en
AIzaSyAYiBZKx7MnpbEhh9jyipgxe19OcubqV5w
April 1, 2024
150444
Honduras
HND
true
2
1
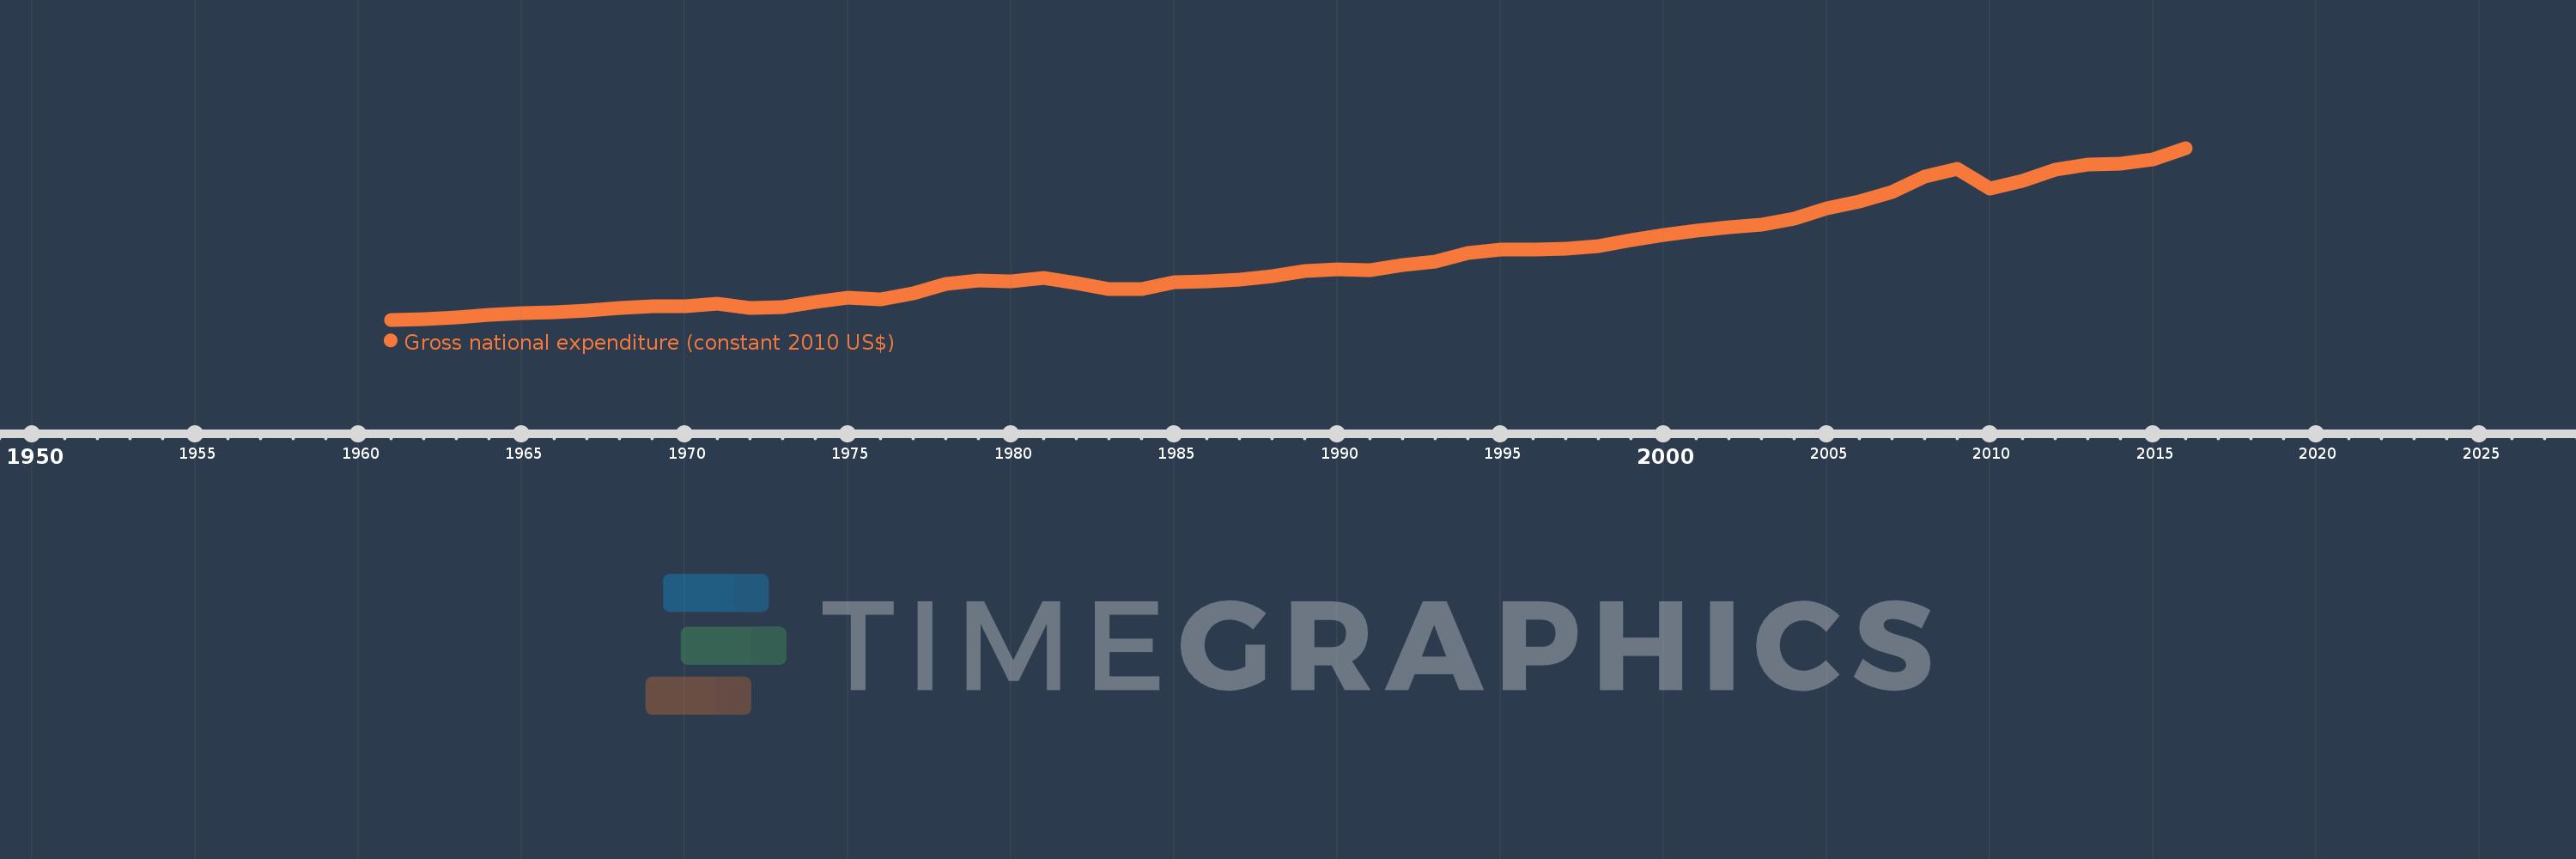
Gross national expenditure (constant 2010 US$)
2016,2015,2014,2013,2012,2011,2010,2009,2008,2007,2006,2005,2004,2003,2002,2001,2000,1999,1998,1997,1996,1995,1994,1993,1992,1991,1990,1989,1988,1987,1986,1985,1984,1983,1982,1981,1980,1979,1978,1977,1976,1975,1974,1973,1972,1971,1970,1969,1968,1967,1966,1965,1964,1963,1962,1961
This statistics in other country:
AfghanistanAlbaniaAlgeriaAngolaAntigua and BarbudaArab WorldArgentinaArmeniaArubaAustraliaAustriaAzerbaijanBahamas, TheBahrainBangladeshBarbadosBelarusBelgiumBelizeBeninBermudaBhutanBoliviaBosnia and HerzegovinaBotswanaBrazilBrunei DarussalamBulgariaBurkina FasoBurundiCabo VerdeCambodiaCameroonCanadaCaribbean small statesCentral African RepublicCentral Europe and the BalticsChadChileChinaColombiaComorosCongo, Dem. Rep.Congo, Rep.Costa RicaCote d'IvoireCroatiaCubaCyprusCzech RepublicDenmarkDominicaDominican RepublicEarly-demographic dividendEast Asia & PacificEast Asia & Pacific (excluding high income)East Asia & Pacific (IDA & IBRD countries)EcuadorEgypt, Arab Rep.El SalvadorEquatorial GuineaEritreaEstoniaEuro areaEurope & Central AsiaEurope & Central Asia (excluding high income)Europe & Central Asia (IDA & IBRD countries)European UnionFaroe IslandsFijiFinlandFragile and conflict affected situationsFranceGabonGambia, TheGeorgiaGermanyGhanaGreeceGrenadaGuatemalaGuineaGuinea-BissauGuyanaHaitiHeavily indebted poor countries (HIPC)High incomeHondurasHong Kong SAR, ChinaHungaryIBRD onlyIcelandIDA & IBRD totalIDA blendIDA onlyIDA totalIndiaIndonesiaIran, Islamic Rep.IraqIrelandIsraelItalyJamaicaJapanJordanKazakhstanKenyaKiribatiKorea, Rep.KosovoKuwaitKyrgyz RepublicLao PDRLate-demographic dividendLatin America & Caribbean Latin America & Caribbean (excluding high income)Latin America & the Caribbean (IDA & IBRD countries)LatviaLeast developed countries: UN classificationLebanonLiberiaLibyaLithuaniaLow & middle incomeLow incomeLower middle incomeLuxembourgMacao SAR, ChinaMacedonia, FYRMadagascarMalawiMalaysiaMaldivesMaliMaltaMauritaniaMauritiusMexicoMiddle East & North AfricaMiddle East & North Africa (excluding high income)Middle East & North Africa (IDA & IBRD countries)Middle incomeMoldovaMongoliaMontenegroMoroccoMozambiqueMyanmarNamibiaNepalNetherlandsNew ZealandNicaraguaNigerNigeriaNorth AmericaNorwayOECD membersOmanOther small statesPacific island small statesPakistanPalauPanamaParaguayPeruPhilippinesPolandPortugalPost-demographic dividendPre-demographic dividendPuerto RicoQatarRomaniaRussian FederationRwandaSamoaSaudi ArabiaSenegalSerbiaSeychellesSierra LeoneSingaporeSlovak RepublicSloveniaSmall statesSolomon IslandsSouth AfricaSouth AsiaSouth Asia (IDA & IBRD)South SudanSpainSri LankaSt. Kitts and NevisSt. LuciaSt. Vincent and the GrenadinesSub-Saharan Africa Sub-Saharan Africa (excluding high income)Sub-Saharan Africa (IDA & IBRD countries)SudanSurinameSwazilandSwedenSwitzerlandTajikistanTanzaniaThailandTimor-LesteTogoTongaTrinidad and TobagoTunisiaTurkeyTurkmenistanUgandaUkraineUnited Arab EmiratesUnited KingdomUnited StatesUpper middle incomeUruguayUzbekistanVanuatuVenezuela, RBVietnamWest Bank and GazaWorldYemen, Rep.ZambiaZimbabwe Timeline:
This timeline shows a graph from 1961 to 2016 of Honduras. No data until 1960. Number of actual observations by date: 56.
Source name:
World Development Indicators
Source organization:
World Bank national accounts data, and OECD National Accounts data files.
Categories, topics:
Economy & Growth
Last updated:
apr 23, 2017
Indicators value changes by year
Minimum:
2.297 bln
jan 1, 1961
Maximum:
22.39 bln
jan 1, 2016
At the date of observation
Value
Absolute change
Change from previous value
jan 1, 1961
2.297 bln
+2.297 bln
0.0%
jan 1, 1962
2.35 bln
+52.757 mln
2.3%
jan 1, 1963
2.557 bln
+206.531 mln
8.79%
jan 1, 1964
2.855 bln
+298.589 mln
11.68%
jan 1, 1965
3.072 bln
+216.423 mln
7.58%
jan 1, 1966
3.143 bln
+71.44 mln
2.33%
jan 1, 1967
3.356 bln
+212.745 mln
6.77%
jan 1, 1968
3.649 bln
+293.283 mln
8.74%
jan 1, 1969
3.843 bln
+193.936 mln
5.31%
jan 1, 1970
3.905 bln
+61.893 mln
1.61%
jan 1, 1971
4.197 bln
+292.02 mln
7.48%
jan 1, 1972
3.679 bln
-518.332 mln
-12.35%
jan 1, 1973
3.768 bln
+89.05 mln
2.42%
jan 1, 1974
4.346 bln
+578.483 mln
15.35%
jan 1, 1975
4.912 bln
+565.88 mln
13.02%
jan 1, 1976
4.639 bln
-273.083 mln
-5.56%
jan 1, 1977
5.383 bln
+744.435 mln
16.05%
jan 1, 1978
6.529 bln
+1.146 bln
21.28%
jan 1, 1979
6.91 bln
+380.833 mln
5.83%
jan 1, 1980
6.799 bln
-111.057 mln
-1.61%
jan 1, 1981
7.168 bln
+368.834 mln
5.42%
jan 1, 1982
6.637 bln
-531.116 mln
-7.41%
jan 1, 1983
5.901 bln
-735.677 mln
-11.08%
jan 1, 1984
5.9 bln
-1.046 mln
-0.02%
jan 1, 1985
6.733 bln
+832.607 mln
14.11%
jan 1, 1986
6.741 bln
+8.251 mln
0.12%
jan 1, 1987
6.948 bln
+206.864 mln
3.07%
jan 1, 1988
7.345 bln
+396.707 mln
5.71%
jan 1, 1989
8.029 bln
+684.42 mln
9.32%
jan 1, 1990
8.2 bln
+171.11 mln
2.13%
jan 1, 1991
8.051 bln
-149.286 mln
-1.82%
jan 1, 1992
8.661 bln
+610.058 mln
7.58%
jan 1, 1993
9.142 bln
+481.475 mln
5.56%
jan 1, 1994
10.082 bln
+939.219 mln
10.27%
jan 1, 1995
10.472 bln
+390.346 mln
3.87%
jan 1, 1996
10.518 bln
+46.514 mln
0.44%
jan 1, 1997
10.628 bln
+109.221 mln
1.04%
jan 1, 1998
10.945 bln
+316.944 mln
2.98%
jan 1, 1999
11.605 bln
+660.184 mln
6.03%
jan 1, 2000
12.245 bln
+640.091 mln
5.52%
jan 1, 2001
12.747 bln
+502.05 mln
4.1%
jan 1, 2002
13.095 bln
+348.597 mln
2.73%
jan 1, 2003
13.434 bln
+338.417 mln
2.58%
jan 1, 2004
14.074 bln
+640.083 mln
4.76%
jan 1, 2005
15.363 bln
+1.289 bln
9.16%
jan 1, 2006
16.107 bln
+744.912 mln
4.85%
jan 1, 2007
17.268 bln
+1.16 bln
7.2%
jan 1, 2008
19.085 bln
+1.817 bln
10.52%
jan 1, 2009
19.927 bln
+841.926 mln
4.41%
jan 1, 2010
17.637 bln
-2.29 bln
-11.49%
jan 1, 2011
18.549 bln
+911.966 mln
5.17%
jan 1, 2012
19.819 bln
+1.27 bln
6.85%
jan 1, 2013
20.434 bln
+614.784 mln
3.1%
jan 1, 2014
20.527 bln
+93.175 mln
0.46%
jan 1, 2015
21.101 bln
+573.795 mln
2.8%
jan 1, 2016
22.39 bln
+1.289 bln
6.11%
Ranking of countries by current statistics by years


Comments: