29
/
en
AIzaSyAYiBZKx7MnpbEhh9jyipgxe19OcubqV5w
April 1, 2024
55572
Pre-demographic dividend
PRE
false
2
1
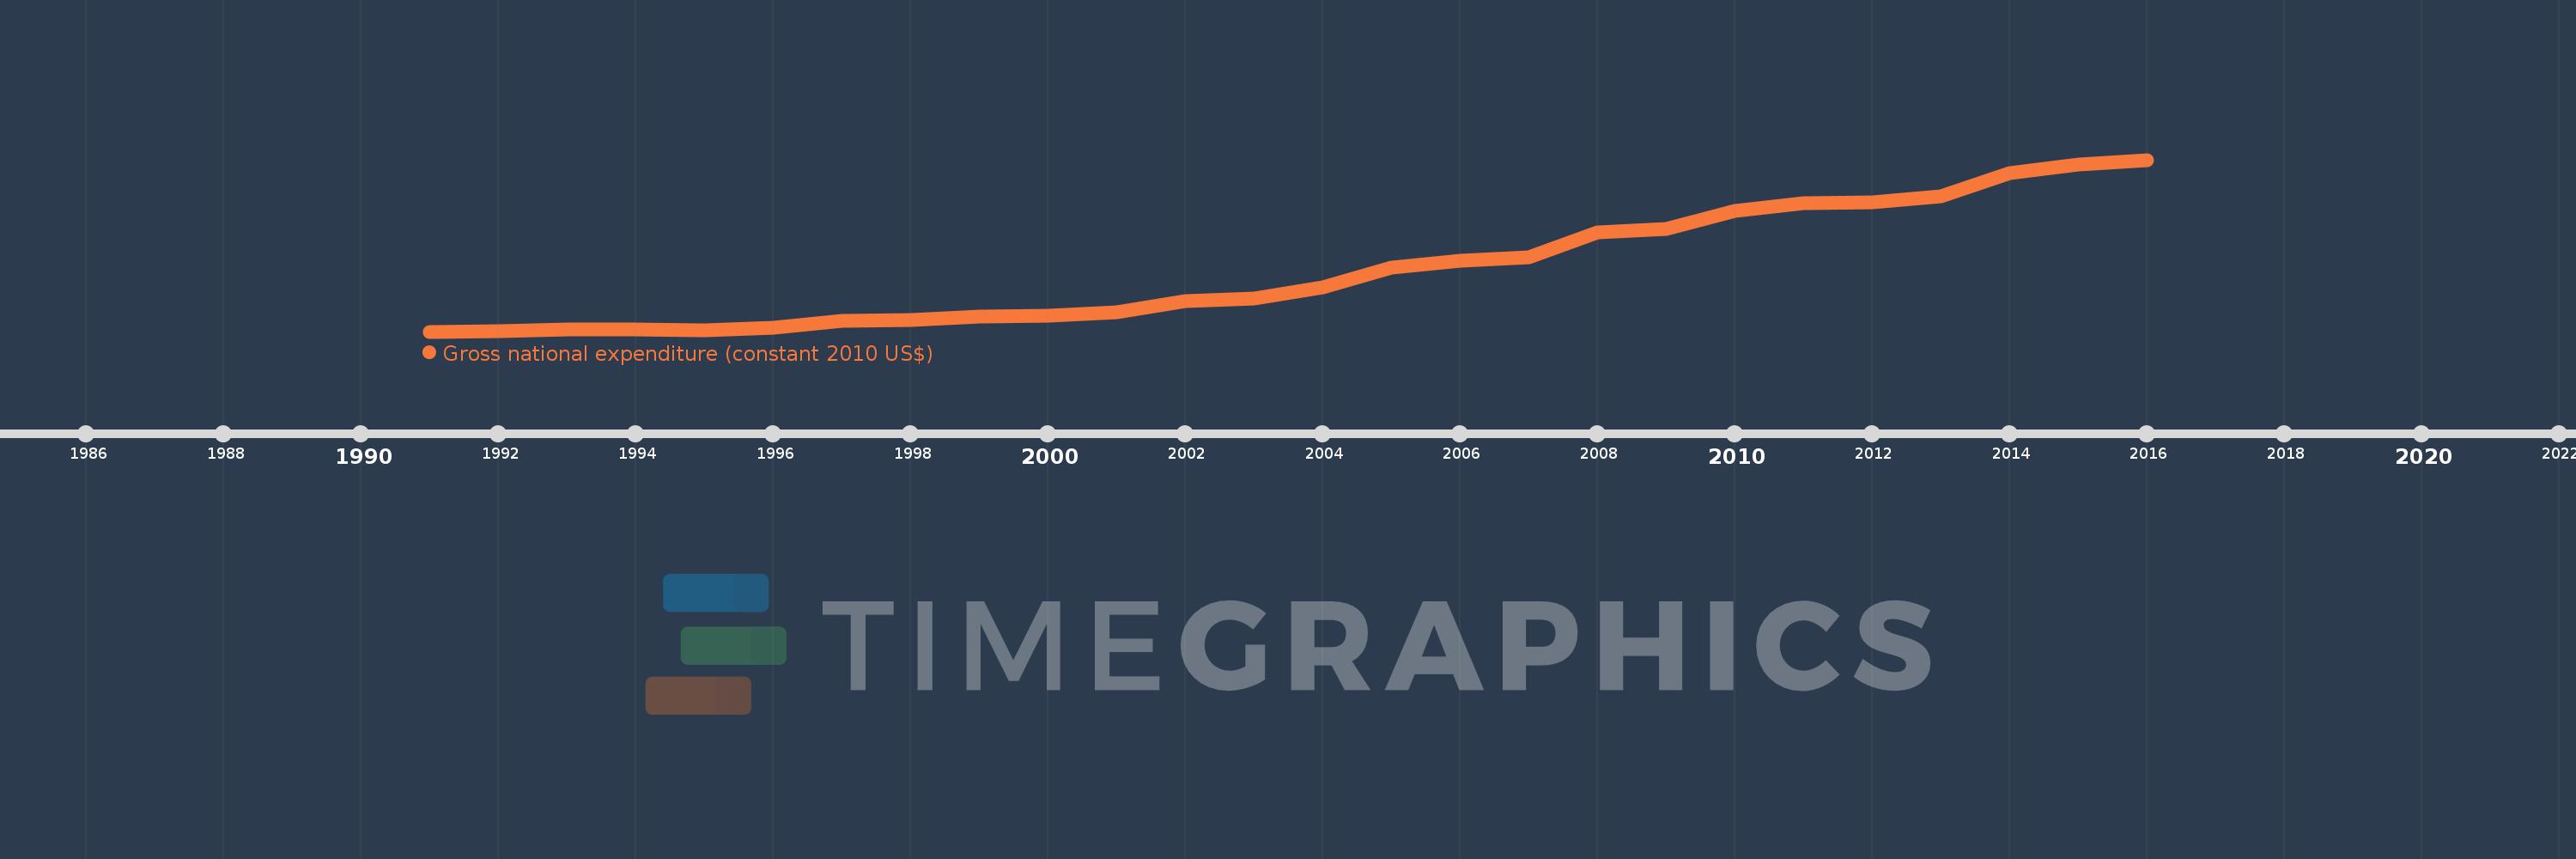
Gross national expenditure (constant 2010 US$)
2016,2015,2014,2013,2012,2011,2010,2009,2008,2007,2006,2005,2004,2003,2002,2001,2000,1999,1998,1997,1996,1995,1994,1993,1992,1991
This statistics in other country:
AfghanistanAlbaniaAlgeriaAngolaAntigua and BarbudaArab WorldArgentinaArmeniaArubaAustraliaAustriaAzerbaijanBahamas, TheBahrainBangladeshBarbadosBelarusBelgiumBelizeBeninBermudaBhutanBoliviaBosnia and HerzegovinaBotswanaBrazilBrunei DarussalamBulgariaBurkina FasoBurundiCabo VerdeCambodiaCameroonCanadaCaribbean small statesCentral African RepublicCentral Europe and the BalticsChadChileChinaColombiaComorosCongo, Dem. Rep.Congo, Rep.Costa RicaCote d'IvoireCroatiaCubaCyprusCzech RepublicDenmarkDominicaDominican RepublicEarly-demographic dividendEast Asia & PacificEast Asia & Pacific (excluding high income)East Asia & Pacific (IDA & IBRD countries)EcuadorEgypt, Arab Rep.El SalvadorEquatorial GuineaEritreaEstoniaEuro areaEurope & Central AsiaEurope & Central Asia (excluding high income)Europe & Central Asia (IDA & IBRD countries)European UnionFaroe IslandsFijiFinlandFragile and conflict affected situationsFranceGabonGambia, TheGeorgiaGermanyGhanaGreeceGrenadaGuatemalaGuineaGuinea-BissauGuyanaHaitiHeavily indebted poor countries (HIPC)High incomeHondurasHong Kong SAR, ChinaHungaryIBRD onlyIcelandIDA & IBRD totalIDA blendIDA onlyIDA totalIndiaIndonesiaIran, Islamic Rep.IraqIrelandIsraelItalyJamaicaJapanJordanKazakhstanKenyaKiribatiKorea, Rep.KosovoKuwaitKyrgyz RepublicLao PDRLate-demographic dividendLatin America & Caribbean Latin America & Caribbean (excluding high income)Latin America & the Caribbean (IDA & IBRD countries)LatviaLeast developed countries: UN classificationLebanonLiberiaLibyaLithuaniaLow & middle incomeLow incomeLower middle incomeLuxembourgMacao SAR, ChinaMacedonia, FYRMadagascarMalawiMalaysiaMaldivesMaliMaltaMauritaniaMauritiusMexicoMiddle East & North AfricaMiddle East & North Africa (excluding high income)Middle East & North Africa (IDA & IBRD countries)Middle incomeMoldovaMongoliaMontenegroMoroccoMozambiqueMyanmarNamibiaNepalNetherlandsNew ZealandNicaraguaNigerNigeriaNorth AmericaNorwayOECD membersOmanOther small statesPacific island small statesPakistanPalauPanamaParaguayPeruPhilippinesPolandPortugalPost-demographic dividendPre-demographic dividendPuerto RicoQatarRomaniaRussian FederationRwandaSamoaSaudi ArabiaSenegalSerbiaSeychellesSierra LeoneSingaporeSlovak RepublicSloveniaSmall statesSolomon IslandsSouth AfricaSouth AsiaSouth Asia (IDA & IBRD)South SudanSpainSri LankaSt. Kitts and NevisSt. LuciaSt. Vincent and the GrenadinesSub-Saharan Africa Sub-Saharan Africa (excluding high income)Sub-Saharan Africa (IDA & IBRD countries)SudanSurinameSwazilandSwedenSwitzerlandTajikistanTanzaniaThailandTimor-LesteTogoTongaTrinidad and TobagoTunisiaTurkeyTurkmenistanUgandaUkraineUnited Arab EmiratesUnited KingdomUnited StatesUpper middle incomeUruguayUzbekistanVanuatuVenezuela, RBVietnamWest Bank and GazaWorldYemen, Rep.ZambiaZimbabwe Timeline:
This timeline shows a graph from 1991 to 2016 of Pre-demographic dividend. No data until 1990. Number of actual observations by date: 26.
Source name:
World Development Indicators
Source organization:
World Bank national accounts data, and OECD National Accounts data files.
Categories, topics:
Economy & Growth
Last updated:
apr 23, 2017
Indicators value changes by year
Minimum:
365.037 bln
jan 1, 1991
Maximum:
1.175 trl
jan 1, 2016
At the date of observation
Value
Absolute change
Change from previous value
jan 1, 1991
365.037 bln
+365.037 bln
0.0%
jan 1, 1992
366.531 bln
+1.495 bln
0.41%
jan 1, 1993
374.529 bln
+7.998 bln
2.18%
jan 1, 1994
373.834 bln
-694.928 mln
-0.19%
jan 1, 1995
372.404 bln
-1.431 bln
-0.38%
jan 1, 1996
382.501 bln
+10.097 bln
2.71%
jan 1, 1997
415.76 bln
+33.259 bln
8.7%
jan 1, 1998
420.823 bln
+5.063 bln
1.22%
jan 1, 1999
437.599 bln
+16.776 bln
3.99%
jan 1, 2000
441.331 bln
+3.732 bln
0.85%
jan 1, 2001
457.593 bln
+16.262 bln
3.68%
jan 1, 2002
508.419 bln
+50.826 bln
11.11%
jan 1, 2003
520.087 bln
+11.668 bln
2.29%
jan 1, 2004
571.814 bln
+51.727 bln
9.95%
jan 1, 2005
666.462 bln
+94.649 bln
16.55%
jan 1, 2006
700.473 bln
+34.011 bln
5.1%
jan 1, 2007
715.265 bln
+14.792 bln
2.11%
jan 1, 2008
833.592 bln
+118.328 bln
16.54%
jan 1, 2009
848.912 bln
+15.32 bln
1.84%
jan 1, 2010
933.686 bln
+84.773 bln
9.99%
jan 1, 2011
970.501 bln
+36.815 bln
3.94%
jan 1, 2012
972.793 bln
+2.292 bln
0.24%
jan 1, 2013
1.005 trl
+32.193 bln
3.31%
jan 1, 2014
1.113 trl
+108.342 bln
10.78%
jan 1, 2015
1.154 trl
+40.346 bln
3.62%
jan 1, 2016
1.175 trl
+21.648 bln
1.88%
Ranking of countries by current statistics by years


Comments: