29
/
en
AIzaSyAYiBZKx7MnpbEhh9jyipgxe19OcubqV5w
April 1, 2024
268054
Tunisia
TUN
true
2
1
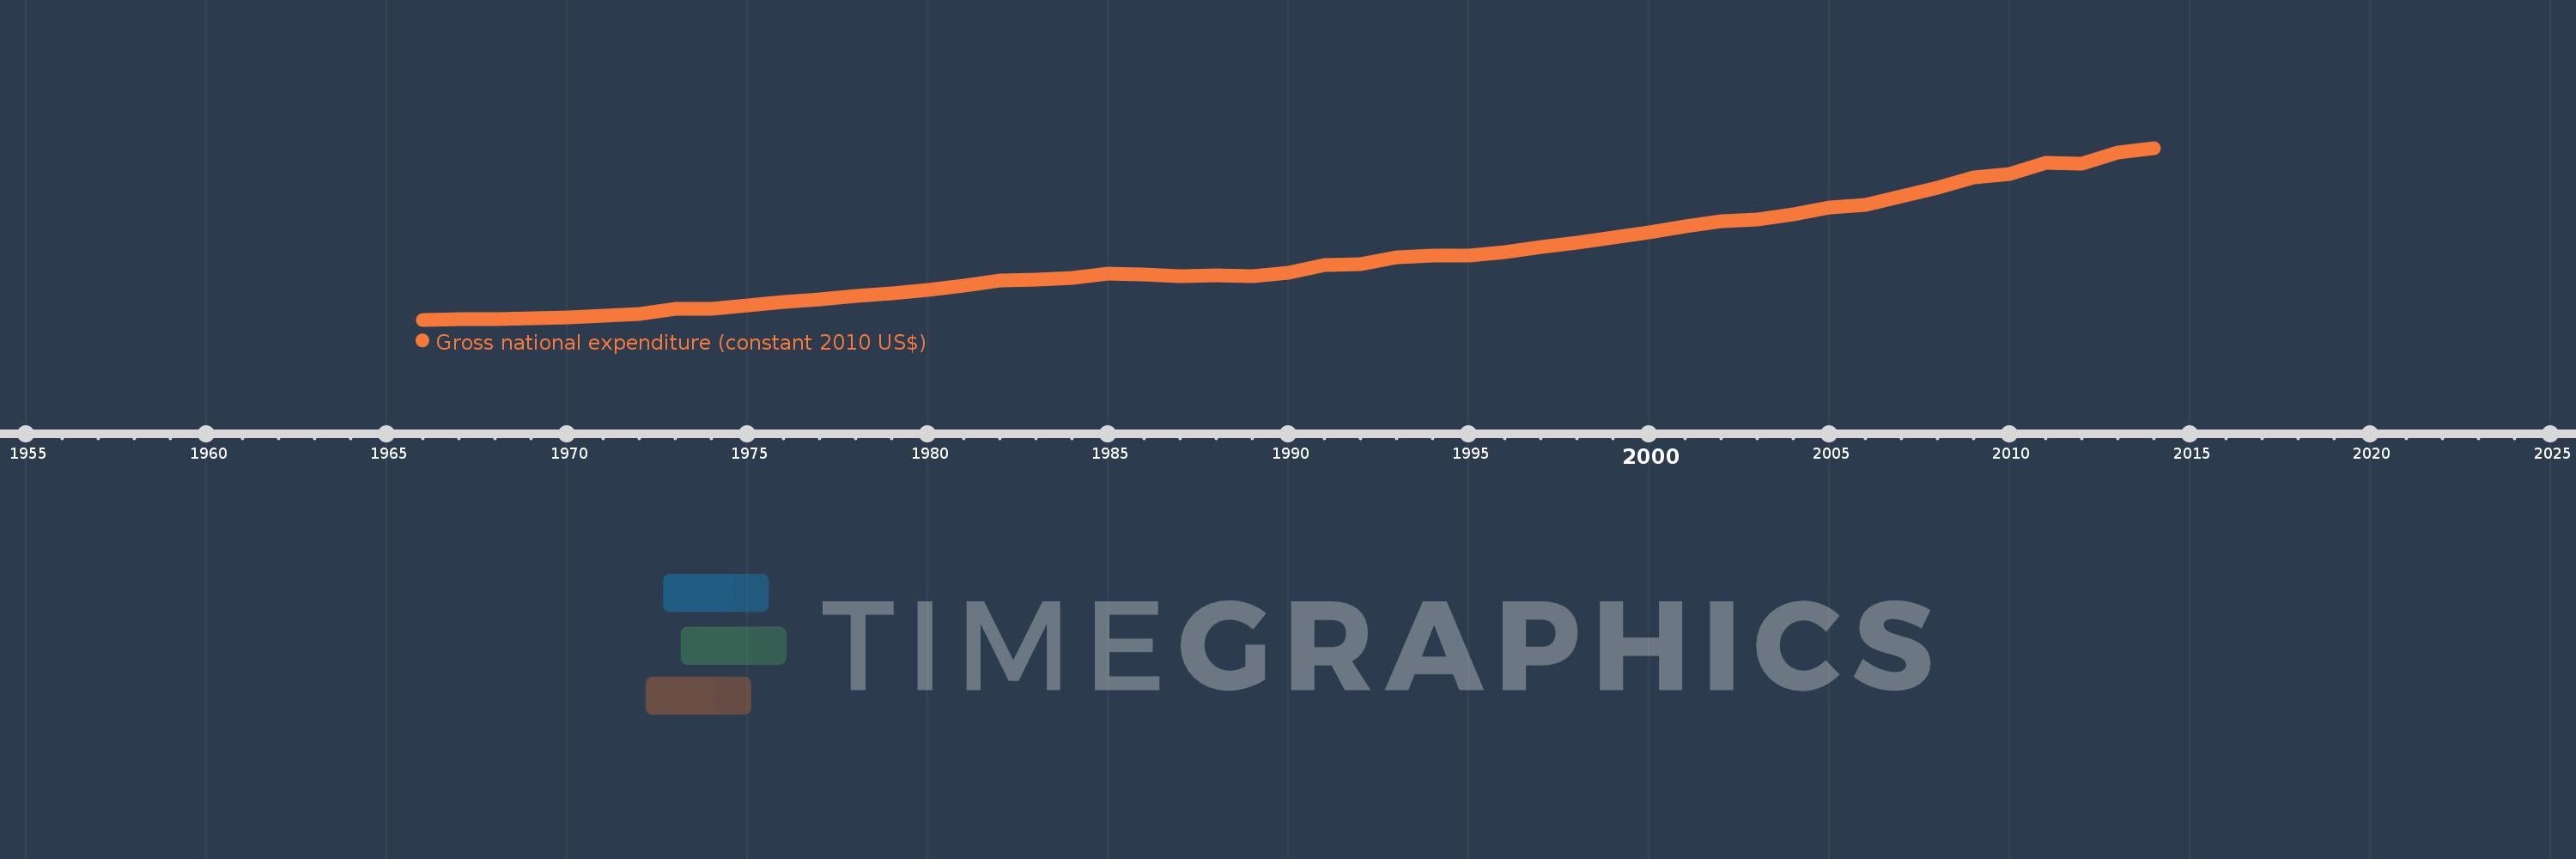
Gross national expenditure (constant 2010 US$)
2014,2013,2012,2011,2010,2009,2008,2007,2006,2005,2004,2003,2002,2001,2000,1999,1998,1997,1996,1995,1994,1993,1992,1991,1990,1989,1988,1987,1986,1985,1984,1983,1982,1981,1980,1979,1978,1977,1976,1975,1974,1973,1972,1971,1970,1969,1968,1967,1966
This statistics in other country:
AfghanistanAlbaniaAlgeriaAngolaAntigua and BarbudaArab WorldArgentinaArmeniaArubaAustraliaAustriaAzerbaijanBahamas, TheBahrainBangladeshBarbadosBelarusBelgiumBelizeBeninBermudaBhutanBoliviaBosnia and HerzegovinaBotswanaBrazilBrunei DarussalamBulgariaBurkina FasoBurundiCabo VerdeCambodiaCameroonCanadaCaribbean small statesCentral African RepublicCentral Europe and the BalticsChadChileChinaColombiaComorosCongo, Dem. Rep.Congo, Rep.Costa RicaCote d'IvoireCroatiaCubaCyprusCzech RepublicDenmarkDominicaDominican RepublicEarly-demographic dividendEast Asia & PacificEast Asia & Pacific (excluding high income)East Asia & Pacific (IDA & IBRD countries)EcuadorEgypt, Arab Rep.El SalvadorEquatorial GuineaEritreaEstoniaEuro areaEurope & Central AsiaEurope & Central Asia (excluding high income)Europe & Central Asia (IDA & IBRD countries)European UnionFaroe IslandsFijiFinlandFragile and conflict affected situationsFranceGabonGambia, TheGeorgiaGermanyGhanaGreeceGrenadaGuatemalaGuineaGuinea-BissauGuyanaHaitiHeavily indebted poor countries (HIPC)High incomeHondurasHong Kong SAR, ChinaHungaryIBRD onlyIcelandIDA & IBRD totalIDA blendIDA onlyIDA totalIndiaIndonesiaIran, Islamic Rep.IraqIrelandIsraelItalyJamaicaJapanJordanKazakhstanKenyaKiribatiKorea, Rep.KosovoKuwaitKyrgyz RepublicLao PDRLate-demographic dividendLatin America & Caribbean Latin America & Caribbean (excluding high income)Latin America & the Caribbean (IDA & IBRD countries)LatviaLeast developed countries: UN classificationLebanonLiberiaLibyaLithuaniaLow & middle incomeLow incomeLower middle incomeLuxembourgMacao SAR, ChinaMacedonia, FYRMadagascarMalawiMalaysiaMaldivesMaliMaltaMauritaniaMauritiusMexicoMiddle East & North AfricaMiddle East & North Africa (excluding high income)Middle East & North Africa (IDA & IBRD countries)Middle incomeMoldovaMongoliaMontenegroMoroccoMozambiqueMyanmarNamibiaNepalNetherlandsNew ZealandNicaraguaNigerNigeriaNorth AmericaNorwayOECD membersOmanOther small statesPacific island small statesPakistanPalauPanamaParaguayPeruPhilippinesPolandPortugalPost-demographic dividendPre-demographic dividendPuerto RicoQatarRomaniaRussian FederationRwandaSamoaSaudi ArabiaSenegalSerbiaSeychellesSierra LeoneSingaporeSlovak RepublicSloveniaSmall statesSolomon IslandsSouth AfricaSouth AsiaSouth Asia (IDA & IBRD)South SudanSpainSri LankaSt. Kitts and NevisSt. LuciaSt. Vincent and the GrenadinesSub-Saharan Africa Sub-Saharan Africa (excluding high income)Sub-Saharan Africa (IDA & IBRD countries)SudanSurinameSwazilandSwedenSwitzerlandTajikistanTanzaniaThailandTimor-LesteTogoTongaTrinidad and TobagoTunisiaTurkeyTurkmenistanUgandaUkraineUnited Arab EmiratesUnited KingdomUnited StatesUpper middle incomeUruguayUzbekistanVanuatuVenezuela, RBVietnamWest Bank and GazaWorldYemen, Rep.ZambiaZimbabwe Timeline:
This timeline shows a graph from 1966 to 2014 of Tunisia. No data until 1965. Number of actual observations by date: 49.
Source name:
World Development Indicators
Source organization:
World Bank national accounts data, and OECD National Accounts data files.
Categories, topics:
Economy & Growth
Last updated:
apr 23, 2017
Indicators value changes by year
Minimum:
5.806 bln
jan 1, 1966
Maximum:
50.018 bln
jan 1, 2014
At the date of observation
Value
Absolute change
Change from previous value
jan 1, 1966
5.806 bln
+5.806 bln
0.0%
jan 1, 1967
5.862 bln
+55.644 mln
0.96%
jan 1, 1968
5.962 bln
+100.543 mln
1.72%
jan 1, 1969
6.094 bln
+131.783 mln
2.21%
jan 1, 1970
6.347 bln
+252.993 mln
4.15%
jan 1, 1971
6.802 bln
+455.495 mln
7.18%
jan 1, 1972
7.231 bln
+428.562 mln
6.3%
jan 1, 1973
8.517 bln
+1.286 bln
17.79%
jan 1, 1974
8.644 bln
+126.696 mln
1.49%
jan 1, 1975
9.493 bln
+849.319 mln
9.83%
jan 1, 1976
10.411 bln
+917.807 mln
9.67%
jan 1, 1977
11.125 bln
+713.583 mln
6.85%
jan 1, 1978
11.84 bln
+715.176 mln
6.43%
jan 1, 1979
12.656 bln
+816.113 mln
6.89%
jan 1, 1980
13.392 bln
+736.12 mln
5.82%
jan 1, 1981
14.524 bln
+1.132 bln
8.45%
jan 1, 1982
15.827 bln
+1.303 bln
8.97%
jan 1, 1983
16.104 bln
+277.413 mln
1.75%
jan 1, 1984
16.56 bln
+456.133 mln
2.83%
jan 1, 1985
17.627 bln
+1.066 bln
6.44%
jan 1, 1986
17.481 bln
-145.965 mln
-0.83%
jan 1, 1987
16.917 bln
-563.556 mln
-3.22%
jan 1, 1988
17.19 bln
+272.65 mln
1.61%
jan 1, 1989
17.022 bln
-167.373 mln
-0.97%
jan 1, 1990
17.936 bln
+913.203 mln
5.36%
jan 1, 1991
19.782 bln
+1.847 bln
10.3%
jan 1, 1992
20.106 bln
+323.266 mln
1.63%
jan 1, 1993
21.959 bln
+1.853 bln
9.22%
jan 1, 1994
22.403 bln
+444.336 mln
2.02%
jan 1, 1995
22.365 bln
-37.965 mln
-0.17%
jan 1, 1996
23.099 bln
+733.851 mln
3.28%
jan 1, 1997
24.437 bln
+1.337 bln
5.79%
jan 1, 1998
25.682 bln
+1.246 bln
5.1%
jan 1, 1999
26.961 bln
+1.278 bln
4.98%
jan 1, 2000
28.307 bln
+1.347 bln
4.99%
jan 1, 2001
29.773 bln
+1.466 bln
5.18%
jan 1, 2002
31.131 bln
+1.358 bln
4.56%
jan 1, 2003
31.565 bln
+433.731 mln
1.39%
jan 1, 2004
33.039 bln
+1.474 bln
4.67%
jan 1, 2005
34.748 bln
+1.709 bln
5.17%
jan 1, 2006
35.391 bln
+642.655 mln
1.85%
jan 1, 2007
37.64 bln
+2.249 bln
6.35%
jan 1, 2008
39.885 bln
+2.245 bln
5.96%
jan 1, 2009
42.43 bln
+2.545 bln
6.38%
jan 1, 2010
43.323 bln
+892.879 mln
2.1%
jan 1, 2011
46.166 bln
+2.843 bln
6.56%
jan 1, 2012
45.902 bln
-263.161 mln
-0.57%
jan 1, 2013
48.826 bln
+2.923 bln
6.37%
jan 1, 2014
50.018 bln
+1.193 bln
2.44%
Ranking of countries by current statistics by years


Comments: